Enough is Enough, and More is Too Much: Between Basic Dignity and Excess/Hoarding Thresholds

IN A NUTSHELL
Author's Note
Achieving fairness in humanity is vital to realizing the global health goal outlined in the WHO Constitution: ensuring the highest attainable level of health for all people. As Plato observed over 2,300 years ago, a just society is one where everyone has enough, and no one has too much. By analyzing healthy, replicable, and sustainable (HRS) countries—characterized by features such as more rural lifestyles, localized economies, and lower calorie consumption—we can estimate the "dignity threshold." This threshold represents the minimum level of GDP per capita below which, in 62 years of available records, no country has achieved optimal health outcomes.

We also identified a "GDP per capita proxy," reflecting the income and wealth levels of countries and regions with the highest life expectancy—a widely recognized indicator of health and human well-being. Beyond this level, referred to as the "excess threshold," additional GDP per capita does not result in improved health or well-being and has been described by some as "wasted GDP."

Moreover, we determined the GDP per capita level above which global resources could be redistributed to address the equity deficit, potentially preventing 12.6 million deaths annually in countries below the dignity threshold. GDP exceeding this level not only fails to enhance human well-being but also violates planetary boundaries and contributes to loss of life. We have therefore labeled it "toxic GDP."

The next step in this analysis involves further exploration and identification of HRS population groups, their defining features, and the equitable levels of global redistribution—both subnational and international—to achieve global health equity and uphold the universal right to health

By Juan Garay

Professor of global health equity in Spain (ENS), Mexico (UNACH) and Cuba (ELAM, UCLV and UNAH), senior researcher of FioCruz Institute, Brazil

Enough is Enough, and More is Too Much

Between Basic Dignity and Excess/Hoarding Thresholds


The form of law which I should propose would be as follows:

In a state desirous of being saved from the greatest of all plagues -here should exist among the citizens neither extreme poverty, nor, again, excess of wealth, for both are productive of both these evils. Now, the legislator should determine what is to be the limit of poverty or wealth.

Laws by Plato, 360 BC.


Scene Setting

1948 marked a pivotal moment in humanity’s collective commitment to uphold universal human rights, including the right to health (Article 25) [1], as defined in the Constitution of the World Health Organization (WHO). Health was described as “a state of complete physical, mental, and social well-being,” and the WHO Constitution came into force that same year.

The WHO Constitution obliges all 194 member states to contribute to its foundational goal: achieving the highest attainable level of health for all people[2]. However, this “best feasible level” has never been explicitly identified by the WHO, nor by any country or multilateral institution. This omission may reflect an anthropocentric perspective, which perceives humans as separate from and superior to nature, assigning intrinsic value solely to human life while viewing other entities—such as animals, plants, and natural resources—as mere resources to be exploited for human benefit[3]. This perspective continues to prioritize human life above all else, often without setting any boundaries.

Capitalism, aligned with anthropocentrism[4], has promoted constant competition and “growth” as the pathways to human progress and well-being. These concepts have dominated both ancient and modern history, likely hindering our ability to set limits on the exploitation of the planet that sustains our species—perhaps not for much longer.

We challenge these notions and have ventured to define “feasible levels of health,” recognizing that they must evolve alongside expanding human knowledge and the diminishing natural resources available to us. Even Adam Smith, the father of capitalism, cautioned against the uncritical reverence of the rich and powerful.

“The disposition to admire, and almost to worship, the rich and the powerful, and to despise, or, at least, to neglect persons of poor and mean condition is the great and most universal cause of the corruption of our moral sentiments.” – Adam Smith, Scottish political economist, author, The Wealth of Nations, father of capitalism [1723-1790].

The primary dimensions where limited resources may define feasibility thresholds are ecology and economy. As evidence of environmental depletion and imbalances—most notably global warming—has become undeniable, the ecological limits to human activity on the planet have grown increasingly clear and measurable[5]. The way we utilize, and often exploit, natural resources is closely linked to levels of production, trade, and consumption, typically measured by gross national or domestic product (GNP or GDP).

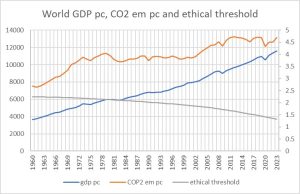
As illustrated in the graph below, the world’s average GDP per capita (constant value) has steadily increased over the past six decades, despite brief periods of economic recession, notably in the late 1970s and the late 2010s. This growth correlates with rising per capita CO2 emissions, which have now surpassed the ethical threshold (i.e., the carbon budget required to limit global temperature increases to below 2°C and maintain human life prospects throughout the 21st century).

Figure 1 Evolution of GDP pc, CO2 emissions pc and CO2 ethical threshold

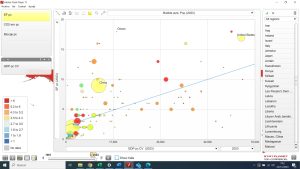
The graph below illustrates the strong correlation between a country’s consumption-based ecological footprint[6]  and its GDP per capita. Outliers with an ecological footprint seemingly lower than predicted by their GDP per capita are primarily countries that rely heavily on imports of natural resources and manufactured goods produced offshore. In these cases, the full environmental impact—assessed through life cycle analysis, which measures a product’s environmental footprint across all phases of its life, from production to disposal—is not fully accounted for[7].

Figure 2 Correlation between GDP pc and CO2 emissions pc, by countries, 2023

There is a strong correlation between economic activity and its direct or indirect impact on natural resources. However, the economy itself has inherent limits, as the scale of production, trade, and consumption cannot be expanded to provide the highest levels for all. Logically, any country with a GDP per capita above the world average cannot be globally replicable at a given time.

Based on these assumptions, we have been identifying countries and subnational population groups that achieve the best health outcomes within feasibility thresholds—that is, those that respect planetary boundaries and maintain economic activity below the world average. Both factors show strong correlation. Since 1961, we have found no country with per capita carbon emissions below the ethical threshold or an ecological footprint below the world average biocapacity per capita, paired with a GDP per capita above the world average.

The identification of Healthy-Replicable-Sustainable (HRS) standards has enabled us to assess the status and progress toward the sole global health goal defined in the WHO Constitution—achieving the best feasible health for all. It has also allowed us to inversely estimate the gap in health outcomes as “excess mortality” (avoidable deaths) compared to the HRS reference.

Data are analyzed periodically by country, time period, sex, and age group, as availability permits. Recent analyses suggest that approximately 16 million excess deaths occur annually—representing 25% of all deaths—a proportion that has remained relatively stable over the past four decades. Excess mortality is disproportionately higher among women (30%), children under 15 years old (80%), and populations in low-income or low-“development” countries (approximately 50%)[8].

Equinomics

Dignity Threshold and Deficit Countries

The identification of “best feasible levels of health,” as described above, enables us to determine the level of GDP per capita associated with the HRS (Healthy-Replicable-Sustainable) reference. This is the threshold below which no country has been able to achieve the shared global health commitment, representing the universal right to health—the most fundamental of all human rights.

Since human rights define the basic standards necessary for a life of dignity, we refer to the HRS GDP per capita as the “dignity threshold.”

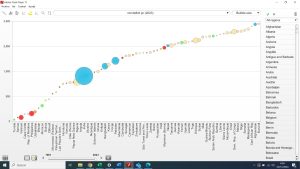
Figure 3 Deficit pc below the ethical threshold, by country, 2023

The graph above illustrates the 72 countries that, in 2023, had a national average GDP per capita below the previously defined dignity threshold and were therefore unable to achieve the best feasible level of health as outlined in the WHO’s constitutional goal. These countries are referred to as “deficit countries.” As shown in the graph, with bubble sizes representing population figures, the per capita deficit ranges from $3,707 per year in Burundi to $67 per year in Tunisia.

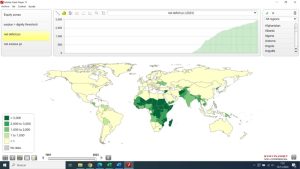
Figure 4 Countries with average GDP pc below the dignity threshold, 2023

As illustrated in the figure above, the deficit countries in 2023 are primarily located in sub-Saharan Africa. They also include Bolivia, Venezuela, Honduras, Guatemala, and Haiti in the Americas; Morocco in Northern Africa; Yemen, Syria, and the Palestinian territories in the Middle East; Ukraine and Moldova in Europe; Tajikistan, Kyrgyzstan, Uzbekistan, Pakistan, and Afghanistan in Central Asia; India, Bangladesh, Nepal, Bhutan, and Myanmar in South Asia; Laos, Cambodia, and the Philippines in Southeast Asia; North Korea in East Asia; and Papua New Guinea, Timor-Leste, Vanuatu, Kiribati, the Solomon Islands, and Samoa in the Pacific.

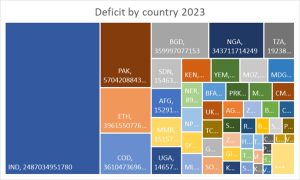
Figure 5 Deficit GDP by country, 2023

The graph above shows that nearly one-third of the world’s deficit in 2023 is attributable to India, followed by Pakistan, Ethiopia, the Democratic Republic of the Congo, Bangladesh, and Nigeria, each contributing around 5%. Together, these six countries account for half of the global deficit below the dignity threshold.

All countries within the deficit zone experience excess deaths above the HRS reference mortality rates. In 2023, the total number of excess deaths in these deficit countries—representing the net burden of health inequity—reached 12.6 million.

The proportion of excess deaths in relation to all deaths (relative burden of health inequity) in each deficit country is displayed in the graph below.

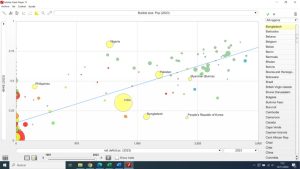
Figure 6 rBHiE by countries in relation to deficit pc, 2023

While the graph above shows a general correlation between higher deficit GDP per capita and higher relative burden of health inequity (rBHiE), there are several notable outliers. For instance, Nigeria has a much higher excess rBHiE (81%) compared to India (32%) or Bangladesh (20%). In general, sub-Saharan deficit countries tend to have a higher rBHiE than Asian deficit countries, even when their deficit GDP per capita levels are similar.

Excess Threshold and Surplus Countries

The analysis that follows presents one of the most provocative conclusions of the global atlas of health inequity, as it challenges the cultural and economic goals of the dominant market economy/capitalist system, which seeks ever-increasing GDP growth. Not only are GDP per capita levels above a certain threshold now incompatible with the sustainable use of natural resources, but, as the following paragraphs will demonstrate, there is a threshold beyond which human well-being and life expectancy no longer improve and, in fact, may even worsen.

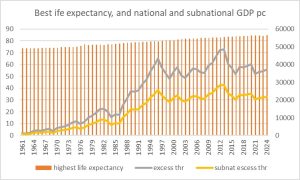
We identified the countries with the highest life expectancy each year from 1961 to 2023, and examined their life expectancy and GDP per capita levels. From 1961 to 1983, Iceland (11 years), Sweden (10 years), and the Netherlands (1 year) had the highest national average life expectancy. From 1984 to the present, Japan has consistently had the highest national average life expectancy. We then analyzed the subnational regions within Japan with the highest life expectancy, focusing on the prefecture of Nara, which reported life expectancy levels of 84.31 years (87.21 for women and 81.36 for men) that exceed the national average, with a GDP per capita of $26,653. The graph below shows the evolution of the highest national levels of life expectancy and their corresponding GDP per capita at both the national and best subnational levels.

Figure 7 Evolution of the highest national life expectancy and its national and subnational GDP pc, 1961-2023

We refer to the GDP per capita of the subregion with the highest life expectancy as the “excess threshold,” above which life expectancy—considered the best measurable proxy for human well-being—ceases to improve further.

The greatest country, the richest country, is not that which has the most capitalists, monopolists, immense grabbings, vast fortunes, with its sad, sad soil of extreme, degrading, damning poverty, but the land in which there are the most homesteads, freeholds — where wealth does not show such contrasts high and low, where all men have enough — a modest living— and no man is made possessor beyond the sane and beautiful necessities.” –Walt Whitman [1819-1892].

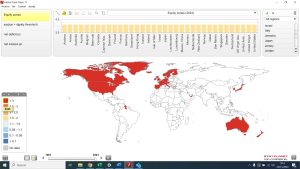
The map below shows the countries with GDP pc higher than the excess threshold in 2023.

Figure 8 Countries with GDP pc above the excess threshold, 2023

The map above shows that countries such as North America, the European Union (excluding Eastern Europe and Greece), Japan, South Korea, Australia, New Zealand, and Guyana (due to recent oil-related GDP growth), as well as Israel, Qatar, Kuwait, and the United Arab Emirates in the Middle East, have GDP per capita above the excess threshold. This level of GDP is often referred to as “wasted GDP,” as it no longer contributes to improvements in life expectancy or human well-being[9].

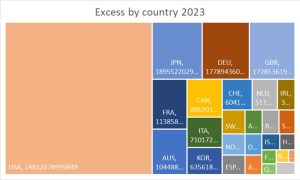
Figure 9 Excess ("wasted") GDP above the excess threshold, by countries, 2023

In 2023, excess GDP above the threshold—beyond which life expectancy and human well-being no longer improve—is concentrated in the USA, accounting for approximately 40% of the global excess. This is followed by Japan, Germany, and the United Kingdom, each with around 8%. The G7 countries collectively hold two-thirds of the global excess GDP, which is ineffective in improving human well-being. This amount is also twice the level required to address the world’s equity deficit and help prevent most of the burden of health inequity, as shown below.

Hoarding threshold

Within countries with excess GDP per capita, we identified the GDP per capita level above which the leveled-off GDP would close the gap in deficit countries. We achieved this by ranking countries according to their GDP per capita and calculating the cumulative differential GDP (GDP per capita multiplied by population). The hoarding threshold represents the GDP per capita above which the cumulative differential GDP meets the deficit gap.

GDP above this level is not only incompatible with respecting planetary boundaries, but it also undermines the right to health for half of the world’s population. As shown below, it indirectly causes over 12 million excess deaths, which is why we refer to it as “toxic GDP.” [10]

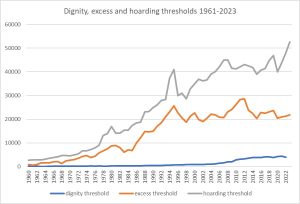
For most of the study period, the number of countries with GDP per capita above the hoarding threshold was fewer than 10, meaning that only the excess GDP from these countries could have closed the deficit gap. The following graph shows the evolution of the excess and hoarding thresholds.

Figure 10 Excess and hoarding thresholds 1961-2023

The graph above illustrates how the hoarding threshold increased in parallel with the excess threshold throughout the 20th century, with a difference of about $10,000 between them during the 1980s and 1990s. Since the turn of the century, the hoarding threshold has risen at a much faster rate, reaching a difference of $20,000 by 2010, a gap that has remained stable since then and peaked in the last three years, after the COVI pandemic, to over $30,000.

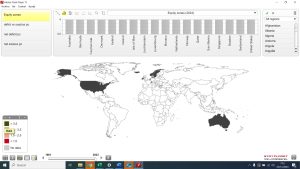
The map below highlights the countries with GDP per capita above the hoarding threshold. The leveled-off GDP in these countries, which is significantly higher than even the “wasted” excess threshold, could close the global GDP deficit and ensure that all people live above the dignity threshold.

Figure 11 Countries with GDP pc above the hoarding threshold, 2023
Live simply so that others may simply live.

Mahatma Gandhi

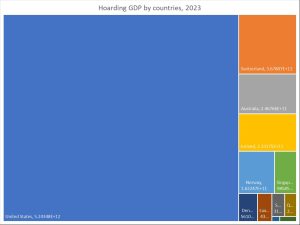
Figure 12 Hoarding GDP by countries, 2023

The graph above shows that 68% of the GDP above the hoarding threshold (which is ineffective for human well-being and sufficient to address the world’s GDP deficit and enable global justice/health equity) remains in the USA. This is followed by smaller shares in Switzerland, Australia, Ireland, and Norway, ranging from 5% to 2%.

Equity Zones

The identification of the aforementioned thresholds allows for the definition of the following “equity zones”: deficit (below the dignity threshold), equity (between the dignity and excess thresholds), excess (between the excess and hoarding thresholds), and hoarding (above the hoarding threshold) zones.

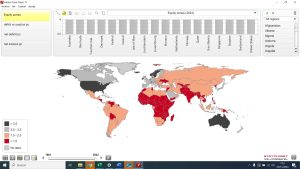
The following map illustrates the distribution of countries in the world in 2023 according to their equity zone.

Figure 13 Countries by equity zone, 2023 (black hoarding, grey excess, orange equity, red deficit)

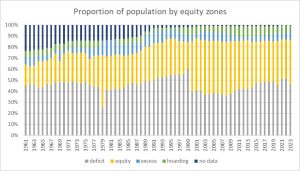
The following graphs represent the evolution of the proportions of the population and GDP by equity zones in the world, from 1961 to 2023:

Figure 14 Proportion of the world population by countries ‘equity zone, 1961-2023

The distribution of the world’s population by countries’ equity zones reveals that around half of humanity lives in countries where GDP per capita is below the dignity threshold, preventing them from enjoying the universal right to health as pledged by all nations under the 1948 WHO Constitution. The fluctuation in 1978 is due to the temporary advancement of India, Indonesia, and Pakistan from the deficit zone to the equity zone, while the shift in 1999 was driven by China’s progress from the deficit to the equity zone, a trend that has remained stable since then.

The graph also shows that the proportion of the global population living in countries within the equity zone has increased from less than 20% in 1961 (partly due to limited data, especially in low-income countries) to around 40% since the turn of the century, largely due to China’s inclusion. The proportion of the world’s population living in countries with GDP per capita above the excess threshold has remained relatively stable, fluctuating between 10-15%, with about half of this population in the hoarding zone.

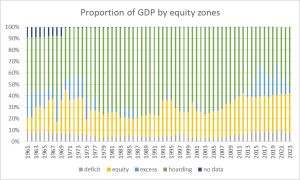
Figure 15 Proportion of the world´s GDP by countries´ equity zone, 1961-2023

The graph above illustrates the skewed and inequitable distribution of global resources, as reflected by GDP according to countries’ equity zones. When compared to the previous graph on population by equity zone, it is evident that from 1961 to 2023, around half of the world’s population has had access to less than 10% of the world’s resources, living without the universal right to health. Meanwhile, less than 10% of the global population, residing in countries with GDP per capita above the excess threshold, has controlled between 60% and 80% of the world’s resources. Even more striking is the fact that less than 5% of the world’s population, living in countries in the hoarding zone, consumes half of the world’s resources.

This extreme inequality in the distribution of the world’s resources—natural means translated into goods and financial power—leads to the loss of human life, as illustrated by the distribution of the net and relative burden of health inequity, shown in the following graphs.

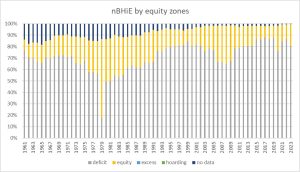
Figure 16 Proportion of excess deaths (nBHiE) by equity zones 1961-2023

The graph above reveals that 80% of the world’s excess deaths—those exceeding the best feasible health level (HRS)—occurred between 1961 and 2023 in countries with a national average GDP per capita below the dignity threshold. The variation in 1978 is due to the temporary inclusion of India, which accounted for nearly half of the world’s net burden of health inequity (nBHiE), in the equity zone. The increase in the share of nBHiE within the equity zone after 1999 is attributable to China’s inclusion in that zone. In 2023, the nBHiE in deficit countries was 12.6 million (out of a total of 15.6 million), highlighting the extreme unfair distribution of global resources by countries.

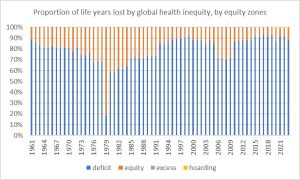
This inequitable distribution becomes even more striking when we examine the distribution of life years lost by equity zone, as shown in the following graph.

Figure 17 Proportion of human life years lost due to global health inequity, by equity zone, 1961-2023

The graph above demonstrates that 90% of all life years lost due to global injustice and health inequity occur in countries with GDP per capita below the dignity threshold. This highlights how income above a certain minimum level is essential for achieving the universal right to health and the best feasible level of health.

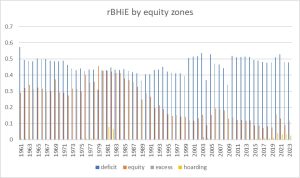
The following graph illustrates the proportion of all deaths that exceed the HRS reference (rBHiE) by equity zone.

Figure 18 rBHiE by equity zone, 1961-2023

The rBHiE in the deficit zone has averaged between 40-50% from 1961 to 2023, remaining fairly stable around 50% since the turn of the century. In contrast, the rBHiE in the equity zone decreased from around 40% in the 1980s to about 10% since the early 2000s. The rBHiE in the excess and hoarding zones has remained very low, except for the 1981-1983 period, when some oil-exporting countries in the hoarding category experienced a higher burden. A recent peak in rBHiE was observed during the COVID-19 pandemic, with lingering effects into 2023, resulting in 1.6% in the excess zone and 2.6% in the hoarding zone—interestingly, these figures were higher than usual.

Conclusions

Market-driven societies, despite some inclusive policies like the European social model, have been unable to set limits on GDP, income, and wealth. This dynamic has led to exceeding planetary boundaries, threatening the survival of both humans and other forms of life, while allowing around 5% of the global population to hoard resources. As a result, half of the world lives with resources below levels compatible with the right to health. The cost of the current system is approximately 12.5 million excess deaths annually. This unfair inequality, which leads to a silent genocide and ecocide, demands a profound transformation. We must ensure dignity-level resources for all, limiting accumulation beyond the hoarding threshold and moving towards the excess threshold. As we are already analyzing, such redistribution could prevent the tragic burden of excess mortality and release wasted GDP (around 27% of global GDP) to invest in global public goods and advance human well-being in harmony with nature.


References

[1] https://www.un.org/en/about-us/universal-declaration-of-human-rights

[2] https://www.who.int/about/governance/constitution

[3] https://www.britannica.com/topic/anthropocentrism

[4] https://www.britannica.com/topic/anthropocentrism

[5] https://www.stockholmresilience.org/research/planetary-boundaries.html

[6] https://www.footprintnetwork.org/what-ecological-footprints-measure/

[7] https://ecochain.com/blog/life-cycle-assessment-lca-guide/#LCA-criticism

[8] The geography of world injustice measured by global health inequity. (In press for cadernos de FioCruz, Brazil and PEAH).

[9] https://www.nature.com/articles/s41599-023-02210-y

[10] https://www.peah.it/2024/04/13164/


By the same Author on PEAH

Geography of Global Injustice: State of the Burden of Global Health Inequity in 2023

The Price of Global Injustice in Loss of Human Life

Identifying International Sustainable Health Models 

Homo Interitans: Countries that Escape, So Far, the Human Bio-Suicidal Trend

Human Ethical Threshold of CO2 Emissions and Projected Life Lost by Excess Emissions

 Restoring Broken Human Deal

   Towards a WISE – Wellbeing in Sustainable Equity – New Paradigm for Humanity

  A Renewed International Cooperation/Partnership Framework in the XXIst Century

 COVID-19 IN THE CONTEXT OF GLOBAL HEALTH EQUITY

 Global Health Inequity 1960-2020 Health and Climate Change: a Third World War with No Guns

 Understanding, Measuring and Acting on Health Equity
News Flash 597: Weekly Snapshot of Public Health Challenges

News Flash Links, as part of the research project PEAH (Policies for Equitable Access to Health), aim to focus on the latest challenges by trade and governments rules to equitable access to health in resource-limited settings

Egg jellyfish (Cotylorhiza tuberculata)

News Flash 597

Weekly Snapshot of Public Health Challenges


New paper sets out why a UN debt convention is urgently needed

Meeting registration: COP29 – Health at the mercy of a poor climate deal. A discussion with Remco van de Pas Nov 28, 2024

‘Betrayal’: Climate Finance Battle Ends in Defeat at COP29

Can Pay, Won’t Pay—COP29 Outcome Far from Promised Historic Deal of a Lifetime

Did COP29 end with a good New Collective Quantified Goal decision?

COP29: poor nations slam climate finance deal

Reporter’s diary: How Baku turned me from a COP optimist into a COP sceptic

Securing Climate and SDG Financing is Only Half the Battle

WIPO: Africa Group & Brazil raise concerns on political pressure against use of TRIPS flexibilities

Paving the Way for Universal Health Coverage in Asia-Pacific and Beyond with Self-care

Unlocking The Full Potential Of Generic Drugs For Patients

The first-ever global oral health conference highlights universal health coverage by 2030

Could games help people stick to HIV treatment?

Expanding ORS/zinc coverage for childhood diarrhoea: is institutionalising free distribution the answer?

Neglected Diseases Are Fierce, But So Is Monique Wasunna

International Pathogen Surveillance Network announces first recipients of grants to better understand disease threats

Microplastics and PFAS Are Dominating Headlines, But Lead is Probably Worse

PETITION – RECKLESS ENDANGERMENT: HOLD SOUTH AFRICAN GOVERNMENT AND CHEMICAL INDUSTRY TO ACCOUNT FOR DEATHS AND SERIOUS ILLNESSES FROM TOXIC PESTICIDES ON THE FARM AND IN FOOD

Geography of Global Injustice: State of the Burden of Global Health Inequity in 2023  by Juan Garay

People’s Health Dispatch Bulletin #89: Attacks on Gaza healthcare reshape protection of health in war; Trump’s return raises health policy fears 

Targeting humanitarians? More aid workers killed in 2024 than ever

HRR 747. WHAT IS IT? MARKETIZATION?, UNFETTERED GLOBALIZATION?, or NEOLIBERAL GLOBAL RESTRUCTURING? ALL OF THE PRECEDING

Committing Gainhopes Towards Low-Income Pregnant Women In Ethiopia   by Liele Netsanet

How Do We Strengthen GBV Prevention and Reporting Mechanisms in Kenya?

China reclaims position as second-largest donor to Pacific Islands, report finds

Brampton, Canada endorses Plant Based Treaty and commits to ambitious plant-based food strategy

Can the World Unite to End the Plastic Pollution Crisis?

Fossil fuel supply: the elephant in the room at climate change conferences

Will SA’s new climate change laws save our beaches — and our health?

Equitable Ocean Prediction Systems: Bridging the North-South Divide

Global heating is a social issue. The EU has a duty to mitigate it, and our data shows it is failing


Geography of Global Injustice: State of the Burden of Global Health Inequity in 2023

IN A NUTSHELL
Editor's Note
As part of a series, an update here on the State of the Burden of Global Health Inequity in 2023. Alongside the recent revision of international demographic data by the United Nations, this update enhances the sensitivity of estimates by increasing the sample size of population and mortality data by country, time period, sex, and age by 25-fold.

Among a number of significant results, the study continues to highlight Sri Lanka as the sole constant Health Reference Standard (HRS) from 1961 to 2023.
 
It also reveals several critical insights as regards the distribution of the burden of health inequity:
India bears the highest net burden of health inequity (nBHiE), with over 3 million excess deaths annually.
Nigeria experiences the highest number of life years lost due to global health inequity (over 110 million annually).
Chad has the highest relative burden of health inequity (rBHiE), with over 90% of all deaths attributed to inequity.
Sub-Saharan Africa, particularly its tropical belt, remains the region most severely impacted by health inequity

By Juan Garay

Professor of global health equity in Spain (ENS), Mexico (UNACH) and Cuba (ELAM, UCLV and UNAH), principal researcher of FioCruz Institute, Brazil

Geography of Global Injustice

State of the Burden of Global Health Inequity in 2023


Since 2010, significant progress has been made in understanding sustainable health equity (SHE) [i], culminating in the development of the Global Atlas of Health Inequity[ii]. In this update, we integrate the latest demographic data from the UN Population Division[iii]. The new dataset expands the granularity significantly, transitioning from 5-year age groups to single-year cohorts and from 5-year intervals to annual data, increasing the volume of information by a factor of 25.

Given the worrying trend of intra and intergenerational levels of inequity/injustice[iv] and the need for a change of concepts of wellbeing in sustainable equity (WISE) applied to the sociopolitical and economic models, and our individual and collective ethics and lifestyles[v], we have updated before the 5-year former frequency period, the atlas of global health inequity/injustice.

  1. Selection of SHE References

As with previous iterations of the atlas, the selection of countries was based on meeting criteria for health, ecological sustainability, and economic replicability. These criteria define “Healthy, Replicable, and Sustainable” (HRS) countries[vi].

While the forthcoming interactive atlas update will enable visualization of temporal variations in national average per capita data, this analysis focuses on the most recent estimates for 2023. In a recent article[vii] and webinar, we detailed the methodology for identifying countries that satisfy the main HRS criteria using world bank[viii] (life expectancy, GDP and GHI pc, CV and PPP, carbon emissions pc), global footprint[ix] (biocapacity and ecological footprint pc) and WHO (healthy life expectancy)[x] data.

The biocapacity of countries with biocapacity per capita below the global average[xi] underscore the arbitrary and inequitable nature of national borders, which, despite their artificiality, are upheld by international law. Countries with biocapacity per capita above the global average enjoy disproportionate natural resource access and cannot be considered ecologically replicable, as such a privilege cannot extend globally. This includes most of the Americas (excluding Mexico and the Caribbean), Europe (except the UK and Italy), Russia, parts of West Africa, Madagascar, and the region spanning Libya to Zambia. These areas do not serve as replicable references for equitable and sustainable well-being.

Recent studies estimate that the threshold of CO2 emissions consistent with limiting global warming to a 2°C rise above preindustrial levels—the “point of no return”—is determined by the remaining carbon budget[xii] divided by the projected global population through the end of the century. The ethical threshold for CO2 emissions is currently approximately 1.34 metric tons per person per year, while limiting warming to below 1.5°C requires emissions as low as 0.3 metric tons per person per year[xiii]. Presently, countries adhering to this ethical threshold are primarily in sub-Saharan Africa, Central America, and South Asia. This distribution closely mirrors the geographical pattern of countries with ecological footprints per capita below the global average biocapacity per capita.

Human Well-being and Health (2023):

In terms of human well-being, countries with life expectancy above the global average include most of the Americas (except Bolivia and Haiti), Europe, Northwest Africa, the Middle East, the Silk Road region from Turkey to China, parts of Southeast Asia, Japan, Australia, and New Zealand. Disaggregating life expectancy by sex reveals slight differences: for males, Kazakhstan is excluded, while for females, Russia is included.

The countries meeting the HRS criteria consistently from 1961 to 2023 are those that simultaneously exhibit:

  • Health criteria: Life expectancy and healthy life expectancy above the global average.
  • Economic replicability criteria: GDP, GNI per capita (both in CV and PPP terms), and wealth per capita below the global average.
  • Ecological replicability/sustainability criteria: Biocapacity per capita below the global average, ecological footprint below the global average biocapacity per capita, and carbon emissions below the ethical threshold.

These countries are summarized in the following table:

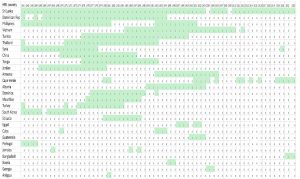
Table 1 List of countries that met all HRS criteria during the 1961-2023 period

Sri Lanka emerged as the country that most consistently met Healthy, Replicable, and Sustainable (HRS) criteria during the period 1961–2024. The only exceptions occurred in 2004 and 2009, when male life expectancy fell slightly below the global average due to elevated young male mortality during the civil war. Considering these circumstances exceptional, Sri Lanka can be regarded as the sole “constant HRS” country over the last 62 years.

A comprehensive analysis of 1,497 development indicators from the World Bank databank compared Sri Lanka’s performance with global averages and those of 55 countries[1] classified as “low health efficiency” (defined as lower life expectancy and higher gross burden of health inequity despite higher GDP per capita than Sri Lanka). Key findings include:

  • Rural population: Sri Lanka has a significantly higher rural population proportion (80.97%) compared to low health efficiency countries (37.23%).
  • Trade policies: The country imposes higher taxes on international trade and import duties (17.1% vs. 6.5% in low health efficiency countries), protecting local production and consumption.
  • Health metrics: According to WHO health statistics, Sri Lanka has a lower average body mass index (23.0 vs. global average 25.0), correlated with lower caloric intake per capita (2,594 kcal/day vs. 2,895 kcal/day) and reduced prevalence of overweight individuals (17.3% vs. 34.3%).
  • Sri Lanka is also unique as the only lower-middle-income country with 100% health insurance coverage, despite allocating a lower share of GDP to health (4.7% vs. 7.33%) and having a higher out-of-pocket health expenditure proportion (46.5% vs. 16.3%), primarily for medicines.

Other HRS References during the study period (1961-2023):

Two countries met HRS criteria for approximately half the 1961–2023 period: Dominican Republic, primarily during the 1960s–1980s and the Philippines, during the 1960s, 1970s, and 1990s.

Three countries met all HRS criteria for about one-third of the study period: Vietnam, from the mid-1980s to 2010, Tunisia, from the mid-1970s to 2000 and Thailand, from the mid-1970s to 1990.

Additional countries meeting HRS criteria for shorter periods include Syria, China, Tonga, Jordan, Armenia, Albania, and several small island nations such as Dominica, St. Lucia, and Mauritius. High-income countries like South Korea and Portugal met HRS criteria briefly in the 1960s.

In the 1970s and 1980s, approximately 10 countries, representing one-fifth of the world population (largely due to China), met HRS criteria. This number declined in the 1990s. From 2010 onward, only 1–3 countries consistently met HRS criteria, including Sri Lanka, Armenia (until 2005), Vietnam (until 2010), Syria (prior to the war), Cape Verde, and Bangladesh (in the last two years of the study period).

Former preliminary analysis identifies subregions in large countries which meet the HRS criteria and add sensitivity in identifying best health feasible models and in estimating the burden of health inequity[xiv]. Likewise, subnational demographic statistics of Sri Lanka[xv] reveal that the southern districts of Sri Lanka have even higher levels of life expectancy, close to 80 years, still with GDP pc below half the world average.

  1. Global Burden of Health Inequity

Using Sri Lanka as the quasi-constant HRS reference (as in the previous analysis of 1960-2020[xvi]), we estimated global health inequity by comparing single-age, sex-specific mortality rates across 218 countries over 62 years (1961–2023), based on the (population and deaths) data from the UN Pop Division[xvii](total of 7,365,300 data). Excess deaths relative to HRS levels constituted the Net Burden of Health Inequity (nBHiE), while the proportion of total deaths exceeding HRS levels represented the Relative Burden of Health Inequity (rBHiE).

As we have recently published[xviii], the estimated number of excess deaths (nBHiE) in 2023 totaled approximately 20 million, representing some 25% of all deaths. This marks a decline from 40% in 1961, although fluctuations occurred due to exceptional events such as the civil war in the HRS reference country, Sri Lanka (2004, 2009) and the impact of the COVID-19 pandemic (2020–2021).

Life years lost (LYLxHiE):

Health inequity accounted for an estimated 800 million life years lost annually, representing 10% of potential human life. This figure has remained stable since the turn of the century, with improvements in under-five mortality offset by higher median ages of excess deaths.

  1. Distribution of the burden of health inequity
  1. Geographical distribution:

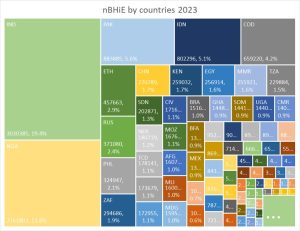
The graph below shows the share of nBHiE by countries in 2023:

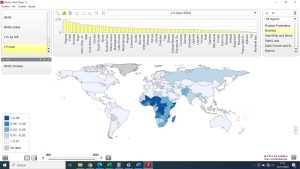
Figure 1 Net burden of health inequity by countries, 2023

India has the highest number of annual excess deaths, with over 3 million, almost 20% of the world´s, followed by Nigeria, with over 2 million, almost 14%. Together they add one third of all excess deaths globally. They are followed by Pakistan, Indonesia and DRC, around 5% each, and Ethiopia, Russia, the Philippines and South Africa, from 2-3% each.

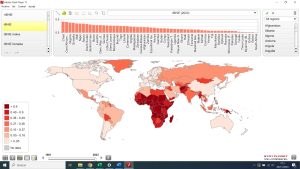
The comparison of the proportion of all deaths which are in excess from feasible/sustainable (HRS) levels, that is, the relative burden of health inequity, is displayed in the following figure.

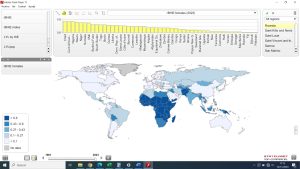
Figure 2 Relative burden of health inequity by countries, 2023

With close to 90%, Chad has the highest rBHiE, followed by the Central African Republic, Nigeria, Somalia and Niger.  In 58 countries deaths in excess of HRS levels are more than half of all deaths, 50 of them are in sub-Saharan Africa.

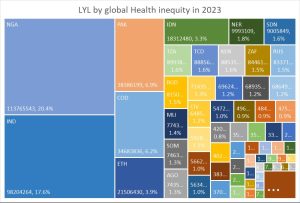
When taking into account the age of each excess (nBHiE) death, the international distribution of life years lost (LLL) by global health inequity shows that Nigeria (with lower median age of its excess deaths) lost last year over 113 million potential human life years, over one in five of all LLL in the world, followed by India, with almost 100 million, 17% of all. They are followed by Pakistan and DR Congo, each with over 35 million LLL and 6% of the world´s. The mentioned five countries comprise over half of the life years lost to health inequity in the world.

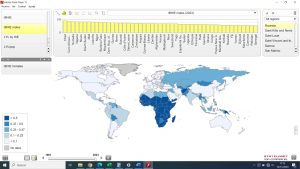
Figure 3 International share of life years lost by global health inequity, 2023

In a comparable way, given diverse population sizes, the life years lost per person reflect the highest rates in Nigeria, Chad, Somalia and Niger, with higher than 0.1 (over one month) each. Again, sub-Saharan Africa is the region with higher burden, highest in the Central African belt.

Figure 4 Distribution of life years lost per person, 2023
  1. Sex distribution:

The comparison between the international rBHiE in males and females relates mainly to higher levels of male than male rBHiE in Russia and former USSR countries, and higher female than male rBHiE in India, Pakistan and part of the Arab world.

Figure 5 Comparison of international rBHiE of females and males, 2023

It is interesting to note the differences between male and female life expectancy over time. While in the 1960s the world average difference, always in favor of women, was over 9%, today, after six decades of global progress in women´s rights, it is barely 7%. Taking the world´s average difference, the following map shows those countries with higher-than-average life expectancy sex gap and those with lower.

Figure 6 Life expectancy sex gap ratio to world´s average 2023

The above figure shows how female health is relatively (to world average) better off than men´s in Russia and former Soviet Union´s republics, Namibia, Thailand and Vietnam. Meanwhile, the sex gap in life expectancy is lower than the world average (relatively worse off than what would be expected for women) in regions where women´s rights lag behind as India, Afghanistan, parts of the Arab world and Muslim Sahel, but also in high income/”development”/advanced women´s rights countries as central and northern Europe (notably Scandinavian countries) and Australia/New Zealand.

  1. Age distribution

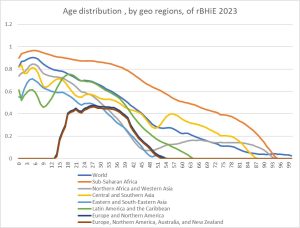
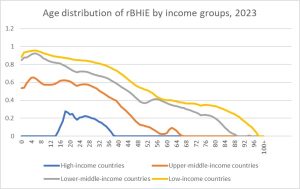
The rBHiE also varies by age and such variations differ between geographic, income and development regions, as the following graphs show:

Figure 7 Average rBHiE age distribution in the world and geo regions

The above figure shows how the proportion of deaths attributable to global inequity is higher in younger age groups and gradually decreases in older age groups. Such pattern is similar in sub-Saharan Africa, yet at higher levels, and in Central and Southern Asia, with a steeper decrease in Latin America, Northern Africa and Eastern and South East Asia and with a hat/elephant shape (the little prince) in Europe and Northern America.

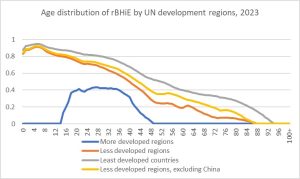
Figure 8 rBHiE average age distribution by country income and development groups 2023

By income and development regions the low income/less and least developed countries follow the decreasing-with-age rBHiE pattern, steeper as average income increases, and the “bump” pattern during the 15–50-year-old group in higher income/development countries.

  1. Factors influencing the burden of health inequity:

We have plotted the relative burden of health inequity against the following economic and health system variables:

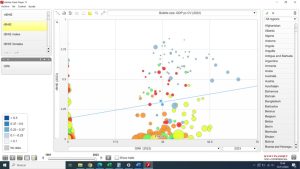
Figure 9 Relative burden of health inequity vs. GDP pc CV, 2023

Similar to the correlation between GDP per capita and life expectancy, the relationship between GDP per capita and the burden of health inequity demonstrates an inverse trend. However, this trend is highly heterogeneous, with the curve flattening above the GDP per capita level of the HRS reference country, Sri Lanka. This analysis highlights the 55 low health-efficiency countries, which have higher GDP per capita than HRS levels but still exhibit significant gross and net health inequity burdens. In some cases, such as the USA, net health inequity (nBHiE) even shows a slight increase at very high GDP per capita levels.

Figure 10 Relation between GINI index and rBHiE, by countries, 2023

We used the national average GINI estimates from the past decade and plotted them against rBHiE levels. The results reveal no clear correlation, as some countries exhibit low inequality but very high rBHiE, and vice versa. The stark contrast between China (GINI 0.46, rBHiE 2%) and India (GINI 0.32, rBHiE 32%) is particularly striking, especially considering that India’s GDP per capita is half the HRS reference level.

However, the relationship becomes more evident as GDP increases. In high-income countries, overall health outcomes—characterized by high life expectancy and low rBHiE—tend to improve as GINI decreases. A notable comparison is between Japan (GINI 0.32, no rBHiE, life expectancy 85 years) and the USA (GINI 0.47, 3% rBHiE, life expectancy 77 years).

Figure 11 National average health expenditure pc in PPP units, 2022, and rBHiE

The graph above illustrates the relationship between health expenditure per capita and rBHiE. Similar to GDP per capita, there appears to be a threshold of health spending per capita beyond which rBHiE does not decrease further. In fact, some countries with significantly higher health expenditure per capita than the HRS reference still exhibit measurable levels of rBHiE.

The case of the USA is particularly notable: even after adjusting for purchasing power parity, health spending is more than 100 times higher than in Sri Lanka, yet it fails to eliminate rBHiE entirely, though the rates are relatively minor.

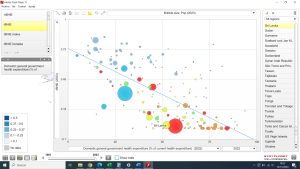
Figure 12 % of health spending pooled by government health spending vs. rBHiE

The proportion of health spending allocated through government services influences better health outcomes, as shown in the figure above. However, this correlation diminishes above 50%—the level seen in the HRS reference. Notably, several countries, including some from the low health efficiency group, exhibit high rBHiE levels despite government health spending exceeding 50%.

Figure 13 % of health spending through out of pocket, vs. rBHiE 2023

One of the primary barriers to equitable access and coverage of health services, as identified by the WHO[xix], is direct payments at the point of delivery. Surprisingly, the graph above reveals no clear correlation between the share of health spending through out-of-pocket payments and rBHiE levels. For example, Sri Lankan citizens allocate one-third of their health budget to direct payments, particularly for medicines at the primary care level, yet remain the HRS reference, with null rBHiE.

Conversely, some countries with a much lower share of out-of-pocket payments, particularly in sub-Saharan Africa (represented by blue bubbles), exhibit high rBHiE rates. Most countries with lower rBHiE levels, such as those in Europe and East Asia, tend to have smaller shares of direct health spending, though this relationship is complicated by GDP per capita as a confounding variable.

The contrast between China and India highlights the complexity of this issue: China has significantly better health outcomes and lower direct health spending, while India has twice the share of out-of-pocket payments and far poorer health indicators. These findings suggest a complex, nonlinear relationship influenced by numerous other factors.

Figure 14 Relation between human resources for health and health outcomes

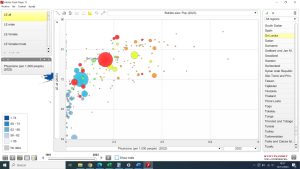
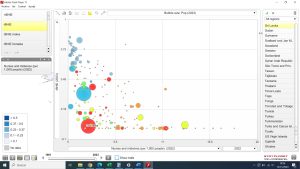
As with health financing, the number of health professionals influences better health (higher life expectancy and lower rBHiE) until reaching a certain threshold above which the curve flattens. The HRS reference enjoys best feasible/sustainable health with 1 physician and 3 nurses/midwives per thousand people, and Japan, the country with highest life expectancy, has 2 physicians and 10 nurse/midwives per each 1000 people. Income, living conditions and overall health financing qualify this and all correlations above described.

Conclusions

The updated identification of the best feasible levels of health, essential for monitoring progress toward the sole global health objective—achieving the best feasible health for all people—continues to highlight Sri Lanka as the sole constant Health Reference Standard (HRS) from 1961 to 2023. This update, alongside the recent revision of international demographic data by the United Nations, has significantly enhanced the sensitivity of estimates by increasing the sample size of population and mortality data by country, time period, sex, and age by 25-fold.

Currently, the burden of health inequity accounts for approximately 20 million excess deaths annually (net burden), representing roughly 25%—or one in four—of all deaths. This equates to around 800 million human life years lost annually, compared to the potential achievable under best feasible health for all populations.

We explored factors underlying the singularity of the HRS model by comparing a wide range of variables between the HRS reference (Sri Lanka), the global average, and low-health-efficiency countries (those with higher GDP per capita than HRS but lower life expectancy and higher gross burdens of health inequity). Key findings include:

  • The HRS model features a higher rural population share, lower weight-for-age and calorie intake per capita, lower global trade engagement, and a tax-based universal health system.
  • Surprisingly, the HRS model has a lower government health spending share and a higher reliance on out-of-pocket payments compared to other systems.

Analysis of the distribution of the burden of health inequity revealed several critical insights:

  • India bears the highest net burden of health inequity (nBHiE), with over 3 million excess deaths annually.
  • Nigeria experiences the highest number of life years lost due to global health inequity (over 110 million annually).
  • Chad has the highest relative burden of health inequity (rBHiE), with over 90% of all deaths attributed to inequity.
  • Sub-Saharan Africa, particularly its tropical belt, remains the region most severely impacted by health inequity.

Sex-specific analysis shows that globally, women experience a higher rBHiE than men (approximately 30% vs. 27%), and this gap has widened since the 1960s. Notably, the genetic advantage of women in life expectancy has decreased, with the life expectancy gap shrinking from 9% in the 1960s to 7% today. Among regions:

  • The former Soviet Union exhibits the largest sex gap, with women often better off or men worse off than expected.
  • Conversely, India, the Arab/Muslim world, and, surprisingly, high-income countries with high women’s rights indices (e.g., Central and Northern Europe, the USA, and Australia) show a smaller-than-average life expectancy gap between sexes.

Age-specific patterns reveal that in regions with high rBHiE—such as sub-Saharan Africa, low-income regions, and least-developed countries—the burden is disproportionately concentrated among children and declines with age. In contrast, countries with lower rBHiE levels show a steeper decline with age, with high-income countries experiencing rBHiE primarily among young adults.

Our analysis of variables associated with higher BHiE levels found that factors such as income inequality (measured by GINI), government health spending shares, out-of-pocket payment shares, and total health spending (adjusted for GDP per capita) are not major determinants of the burden of health inequity, contrary to initial assumptions.

As emphasized in previous studies, advancing to higher-sensitivity analyses using subnational data worldwide is crucial. Such analyses would enable the identification of healthier, more equitable, and sustainable health models, distinct from existing HDI paradigms. They would also provide a clearer understanding of the levels and distribution of health inequity and social injustice, facilitating fair global redistribution efforts and supporting progress toward the universal right to health and the best feasible health for all populations.


Footnote

[1] Algeria, American Samoa, Armenia, Aruba, Azerbaijan, Bahamas, The, Barbados, Belarus, Belize, Botswana, Brazil, Brunei Darussalam, Bulgaria, Curacao, Dominica, Dominican Republic, Egypt,  Arab Rep., El Salvador, Equatorial Guinea, Fiji, Gabon, Georgia, Grenada, Guatemala, Guyana, Indonesia, Iraq, Jamaica, Kazakhstan,  Libya, Lithuania, Malaysia, Marshall Islands, Mauritius, Mexico, Mongolia, Montenegro, Namibia, Nauru, North Macedonia, Palau, Paraguay, Romania, Russian Federation, Serbia, Seychelles, Sint Maarten (Dutch part), South Africa, St. Kitts and Nevis, St. Lucia, St. Vincent and the Grenadines, Suriname, Tonga, Trinidad and Tobago, Turkmenistan

References

[i]Garay JE, Chiriboga DE. A paradigm shift for socioeconomic justice and health: from focusing on inequalities to aiming at sustainable equity. Public Health. 2017 Aug;149:149-158. doi: 10.1016/j.puhe.2017.04.015. Epub 2017 Jun 20. PMID: 28645046.

[ii] https://www.interacademies.org/news/launching-global-health-equity-atlas

[iii]https://population.un.org/wpp/

[iv]https://www.thelancet.com/journals/lancet/article/PIIS0140-6736(24)01339-4/fulltext

[v]https://www.peah.it/2023/12/12800/

[vi]Garay, J., Chiriboga, D., Kelley, N., & Garay, A.  (2019, February 25). Health Equity Metrics. Oxford Research Encyclopedia of Global Public Health. Retrieved 20 Nov. 2024, from https://oxfordre.com/publichealth/view/10.1093/acrefore/9780190632366.001.0001/acrefore-9780190632366-e-62.

[vii]https://www.peah.it/2024/10/identifying-international-sustainable-health-models/

[viii]https://databank.worldbank.org/

[ix]https://data.footprintnetwork.org/#/

[x]https://data.who.int/indicators/i/48D9B0C/C64284D#:~:text=Worldwide%2C%20healthy%20life%20expectancy%20at,%2D%2062.7%5D%20years%20in%202021.

[xi]https://www.footprintnetwork.org/what-biocapacity-measures/#:~:text=Given%20the%2012.2%20billion%20hectares,biocapacity%20per%20person%20on%20Earth.

[xii]https://www.nature.com/articles/s41558-023-01848-5

[xiii]https://www.peah.it/2024/07/13556/

[xiv]https://www.peah.it/2024/11/the-price-of-global-injustice-in-loss-of-human-life/

[xv] www.statistics.gov.lk

[xvi]https://www.peah.it/2021/04/9658/

[xvii] https://population.un.org/wpp/

[xviii]https://www.peah.it/2024/11/the-price-of-global-injustice-in-loss-of-human-life/

[xix] Sirag A, Mohamed Nor N. Out-of-Pocket Health Expenditure and Poverty: Evidence from a Dynamic Panel Threshold Analysis. Healthcare (Basel). 2021 May 3;9(5):536. doi: 10.3390/healthcare9050536 PMID: 34063652; PMCID: PMC8147610

By the same Author on PEAH


The Price of Global Injustice in Loss of Human Life

Identifying International Sustainable Health Models 

Homo Interitans: Countries that Escape, So Far, the Human Bio-Suicidal Trend

Human Ethical Threshold of CO2 Emissions and Projected Life Lost by Excess Emissions

 Restoring Broken Human Deal

   Towards a WISE – Wellbeing in Sustainable Equity – New Paradigm for Humanity

  A Renewed International Cooperation/Partnership Framework in the XXIst Century

 COVID-19 IN THE CONTEXT OF GLOBAL HEALTH EQUITY

 Global Health Inequity 1960-2020 Health and Climate Change: a Third World War with No Guns

 Understanding, Measuring and Acting on Health Equity
Committing Gainhopes Towards Low-Income Pregnant Women In Ethiopia

IN A NUTSHELL
Editor's Note


Find below a brief on an additional initiative by PEAH acknowledged partner and Ethiopian activist Liele Netsanet Desta.

Dr. Netsanet has founded Gainhopes as a visionary non-profit organization with the mission to empower women and provide them with the resources and opportunities they need to overcome obstacles and reach their full potential.

See HERE the interview to her PEAH made few months ago.

Now, in turning the spotlight on Gainhopes initiative summarized below, PEAH aims to serve as an intermediary while inviting our network and interested readership to interact with and comment on the content of this post

By Liele Netsanet, MD

Founder and CEO at Gainhopes,  Ethiopia

lielenetsanet1@gmail.com

+251909525175

Committing Gainhopes Towards Low-Income Pregnant Women In Ethiopia 

Vision of a world where leadership knows no bounds and women are empowered to rise and shine


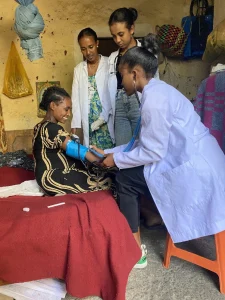
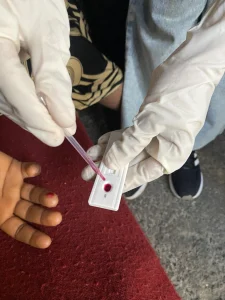
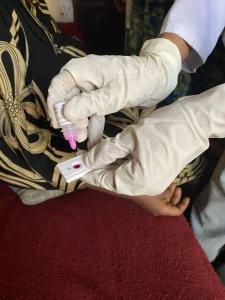
Currently, the Gainhopes team is engaged in doing an outstanding job in preventing mother-to-child transmission of HIV/AIDS through screening and counseling on ART adherence in Ethiopia.

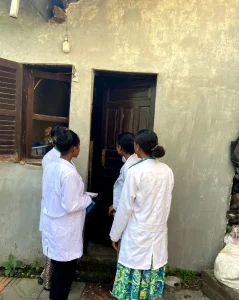
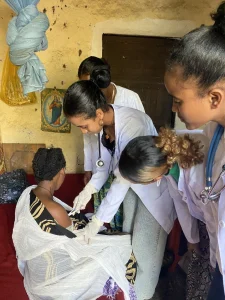
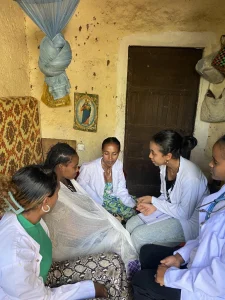
We conduct home-to-home HIV/AIDS screenings to support low-income pregnant women who lack access to antenatal care (ANC) and also screen for pregnancy-related hypertensive disorders to reduce potential negative health outcomes for newborns.

After the screenings, we provide counseling to HIV-positive pregnant women on ART adherence using various techniques and connect them with local hospitals for ANC follow-up.

We facilitate ANC follow-ups for all pregnant women by collaborating with local healthcare centers.

Additionally, we offer counseling on breastfeeding for HIV-positive mothers and provide guidance on perinatal care to help prevent the transmission of HIV to their newborns.


PEAH readers are invited to interact with and comment on the content of this post. Contact person:

Liele Netsanet, MD

lielenetsanet1@gmail.com

+251909525175

By the same Author on PEAH

Proposal Highlight: Providing Sexual and Reproductive Health System for Marginalized Women in Northern Amhara Region, Ethiopia

News Flash 596: Weekly Snapshot of Public Health Challenges

News Flash Links, as part of the research project PEAH (Policies for Equitable Access to Health), aim to focus on the latest challenges by trade and governments rules to equitable access to health in resource-limited settings

Ornate wrasse (Thalassoma pavo)

News Flash 596

Weekly Snapshot of Public Health Challenges


Webinar registration: IFIC Australia Webinar – Is it enough for people to be centered in their care, or should they be driving it? Nov 26, 2024

Webinar registration: IFIC Scotland Webinar: Community Hospitals Nov 27, 2024

Brazil launches a G20 plan to slash hunger across the world

What’s in the G20 road map to transform multilateral development banks?

World AMR Awareness Week 18 – 24 November 2024

EMA: Antimicrobial resistance

Breakthrough Research Promises Shorter Treatment for Multi-Drug-Resistant TB

A Lethal Disease Hidden in Plain Sight in Mexico

Fight or Flight — Facing the Marburg Outbreak in Rwanda

Message by the Director of the Department of Immunization, Vaccines and Biologicals at WHO – September/October 2024

WHO adds LC16m8 mpox vaccine to Emergency Use Listing

From Vision to Reality: mRNA Technology Transfer Programme Building Sustainable Vaccine Manufacturing Ecosystems in LMICs

Can SA afford to not have climate-friendly ARVs?

Number of people globally with uncontrolled diabetes exceeds 445 million, study warns

WHO and partners rally cervical cancer elimination efforts

Roche’s Patent Strategy Creates a Roadblock to Affordable Pertuzumab for Breast Cancer Patients in India

HRR746. SEEKING SILVER LININGS IN DARK CLOUDS IS A FAVORITE PURSUIT OF THE SELF-APPOINTED WESTERN DEVELOPMENT ‘EXPERTS’. DO NOT BE FOOLED

Pathways to Prosperity for Adolescent Girls in Africa

Nearly 3 mln people in Sudan need humanitarian aid due to war: official

The cost of austerity: Wemos’ study assesses the impact of the IMF programme in Zambia

The future of health in Mozambique: policy brief for more budget for health

Empowering Voices for Change: UNPOy Inspires a New Generation of Advocates for Self-Determination

Opinion: These 4 concrete steps will help close the climate finance gap

COP29: Ambitious Climate Finance Goal is not Enough – the Funds must also Reach the Right Communities

Reporter’s notebook: Behind the scenes at COP29

Protest inside COP29 entrance calls for a global Plant Based Treaty

World Resources Institute chief reflects on the nuances of COP29

Putting urban food systems on the table with COP29

Acute food insecurity to hit most people in South Sudan next year, says UN

Make Clean Air Part of Climate Plans, Experts Say

Climate entropy: reflections on the ground from COP29

Pakistani province declares health emergency due to smog and locks down two cities

Scientists harness gene editing for climate-resilient wheat


News Flash 595: Weekly Snapshot of Public Health Challenges

News Flash Links, as part of the research project PEAH (Policies for Equitable Access to Health), aim to focus on the latest challenges by trade and governments rules to equitable access to health in resource-limited settings

Spiny fan-mussel (Pinna rudis)

News Flash 595

Weekly Snapshot of Public Health Challenges


‘Road to Ruin’: Nations Clash over Multi-Trillion Climate Bill as COP29 Opens

Dear COP Negotiators from the Global South: Please Be More Cynical About Your Counterparts from the Global North

7 things to watch for at COP29, from funding to food systems

4 Reasons Why the Climate Coalition Will Win Despite Trump

EU to support continued global climate action and push for ambitious finance and investment goals at COP29

COP29 climate summit: what to expect as key world leaders sit out

COP29: Making Space Applications Work for Women in Agriculture

COP 29 should focus on people-led solutions and holding perpetrators accountable

19 local organisations to watch

What does a good NCQG decision look like?

Four Key Areas Where ‘Anti-Globalist’ Trump Threatens Global Health

What The Election Means For Federal Health Care Legislation

People’s Health Dispatch Bulletin #88: Northern Gaza’s healthcare nears collapse; Valencia braces for post-flood mental health struggles 

HRR745. THERE CAN BE NO ARTIFICIAL INTELLIGENCE WITHOUT ETHICS AND WITHOUT POLITICS 

Where is UK Development Policy Headed Under the New Government?

Healthy Environment: Workshops Report

Meeting registration: Walking the Talk of Decolonization: Institutional Transformation through Localization Nov 14, 2024

Fisherfolk in Uganda welcome decreasing army brutality

No Pandemic Agreement by December as Negotiators Need ‘More Time’

It’s Time to Stop the World’s Oldest Pandemic: We Need a New Tuberculosis Vaccine

MSF calls for equitable access to TB drugs and diagnostics in first-ever plenary session on access at the TB Union Conference

DNDi News: Treating a feverish planet: The Dengue Alliance

Tracking Progress Toward Pneumonia and Diarrhea Control

An Update on Measles, Pertussis, Mpox, and Other Vaccine-Preventable Diseases

Ahead of World Diabetes Day, pharmaceutical corporations Eli Lilly, Novo Nordisk, and Sanofi must make insulin pens available at $1 per pen

MSF comments on replies from Eli Lilly, Novo Nordisk and Sanofi on access to insulin

Urgent action needed as global diabetes cases increase four-fold over past decades

Protecting nutrition in a food crisis

Mandatory salt targets: a key policy tool for global salt reduction efforts

Estimated health benefits, costs, and cost-effectiveness of implementing WHO’s sodium benchmarks for packaged foods in India: a modelling study

UN Climate Summit Needs Action – not a COP-Out

Climate and Development KPIs

Climate Crisis Worsening Already ‘Hellish’ Refugee Situation: UN

Restricting cars in cities: a cost-benefit analysis of Low Emission Zones


News Flash 594: Weekly Snapshot of Public Health Challenges

News Flash Links, as part of the research project PEAH (Policies for Equitable Access to Health), aim to focus on the latest challenges by trade and governments rules to equitable access to health in resource-limited settings

Cleaver wrasse (Xyrichtys novacula)

News Flash 594

Weekly Snapshot of Public Health Challenges


Webinar registration: Unpacking Gilead’s Lenacapavir Voluntary License: Civil Society’s Call for True Access Nov 8, 2024

Webinar registration: “Children’s Rights and Drug Policies: Navigating the Intersection and Evaluating Impact” Nov 13, 2024

Meeting registration: Collaborative Pathways: Engaging Civil Society in AMR action- Briefing Session on Antimicrobial Resistance for civil society groups, during World AMR Awareness Week 2024 Nov 19, 2024

A Time for Change: Reforming the Global Health Architecture

Traditional medicine and global health: a call for papers

G20 Health Ministers Launch Coalition to Promote Local Medicine Production

Relationship between Prices and Quality of Essential Medicines from Different Manufacturers Collected in Cameroon, the Democratic Republic of the Congo, and Nigeria

Long Covid is Real – How This Condition Affects You

Hamid Jafari: the polio endgame and its challenges

Mpox cases in Congo may be stabilizing. Experts say more vaccines are needed to stamp out virus

Rwanda steps up measures against Rift Valley Fever

Audio Interview: The Marburg Virus Outbreak in Rwanda

Rwanda Gets a Grip Of Marburg, But Mpox ‘Not Yet Under Control’

Negotiators Have a Week to Decide if Pandemic Agreement Possible by December

Pandemic Agreement: MSF’s Comments on Selected Provisions of November 2024 Draft

INB12: KEI talking points on Article 11 Transfer of technology and know-how for the production of pandemic-related health products

Why the Pandemic Fund is considering an emergency financing mechanism

WHO study lists top endemic pathogens for which new vaccines are urgently needed

Will SA’s new vaping laws lead to more smokers instead of fewer?

The Price of Global Injustice in Loss of Human Life  by Juan Garay

World Inequality Still Rising Despite Some Convergence 

HRR744. THE TRUE FREEDOM OF HUMANITY CAN ONLY BE ACHIEVED BY FIGHTING THE IGNORANCE PROMOTED BY THE DEFENDERS OF THE STATUS-QUO; OTHERWISE, THE CATASTROPHIC OMENS MAY MATERIALIZE

UNPO Secretary General Mercè Monje Cano Interviewed by Andres Herkel in Estonia

Ethiopia’s health sector evolution and WHO’s mandate

Almost two dozen countries at high risk of acute hunger, UN report reveals

Why localization is key to Indigenous-led nature conservation

COP16 advances biodiversity protection despite ending before finance deal

Delhi Air Pollution: Are Government Satellites Missing the Stubble Fires?

Climate report shows the largest annual drop in EU greenhouse gas emissions for decades

Brazil Promotes a Freer Global Biofuels Market


The Price of Global Injustice in Loss of Human Life

IN A NUTSHELL
Author's Note
As part of a series, a new analysis here calling for subnational data and analysis to render higher sensitivity in identifying ethical efficient human models and in estimating the burden of failing to adjust our lifestyles and human dynamics to sustainable wellbeing patterns

By Juan Garay

Professor of Global Health Equity Ethics and Metrics in Spain (ENS), Mexico (UNAChiapas), and Cuba (ELAM, UCLV, and UNAH)
Co-founder of the Sustainable Health Equity movement
Valyter.es

The Price of Global Injustice in Loss of Human Life

Update of the Analysis of the Global Burden of Health Inequity 1961-2023


1947 WHO’s constitutional goal—achieving the best feasible health for all people[i] is the only globally shared health objective among nations. However, it is not measured by WHO or any government despite the 2009 World Health Assembly commitment to do so[ii].

Failing to identify the best feasible level of health leaves the partial analysis of health inequalities by arbitrary variables as the global reference of health justice monitoring[iii] fueling the fragmentation of health views and actions[iv].

Previous articles this year have used the recent UN Population 1950-2023 population and mortality estimates and 2024-2100 prospects to update the ethical ecological sustainability thresholds—1.42 hectares per capita for biocapacity and ecological footprint[v], and 1.34 metric tons of CO2 emissions per capita[vi]. Only 16 countries have constantly held footprints per capita respecting nature´s recycling capacity constantly from 1961-2023[vii]. All countries with GDP pc above the world average (measuring the economic transactions and their relation with production, trade and consumption) disrespect planetary boundaries, regardless technological advances and often rhetorical global commitments. Amongst the ecologically sustainable countries, only one has levels of life expectancy, that being above the world average, can inspire the world to progress in wellbeing while respecting its resources for coming generations: Sri Lanka. It uses less than half the world’s average economic resources per capita and only 12% of the world average health spending per capita, yet enjoys 10% higher of life expectancy. The international data have major limitations and hide major subnational disparities. The present analysis calls for subnational data and analysis to render higher sensitivity in identifying ethical efficient human models and in estimating the burden of failing to adjust our lifestyles and human dynamics to sustainable wellbeing patterns. Preliminary analysis of larger countries suggests subnational references in some regions of India, China, Russia, Indonesia, Pakistan, Brazil and Bangladesh[viii]. None of the European Union countries, USA states and other OECD countries respect planetary boundaries, and their “development” references, as the human development index ranking, guides towards human self- and nature´s ecocidal destruction[ix].

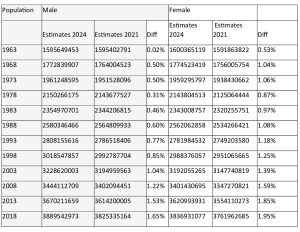
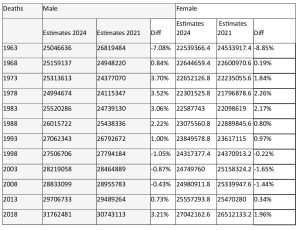
From 2011 to 2021 we have used international data from the world bank, the global footprint network and the world health organization, to select sustainable wellbeing references. As the UN used to publish population and mortality estimates every five years, we estimated the number and proportion of excess deaths from the mentioned references for the periods 1960-2010[x] (book[xi] ), -2015[xii] (book[xiii]) and -2020[xiv] (online atlas[xv]). Up to now, the data were the average of 5-year periods and were disaggregated by country, sex and 5-year age groups. The 2024 revision has been upgraded from 5-year periods to annual time series, and from 5-year age groups to single ages[xvi] and revised retrospectively the full time series since 1950. It incorporates a systematic and comprehensive set of mortality crises for all countries/areas since 1950 and includes excess mortality attributable to COVID-19 in 2020-2021 and since then. The changes are substantial, as the tables below show.

Table 1 World population prospects´ changes from 2021 to 2024 UN reports

Table 2 World deaths estimates´ changes from 2021 to 2024 UN reports

In countries like China they relate to the major historical demographic changes experienced during the Great Leap Forward, the Cultural Revolution and one-child policy periods that have affected population cohorts. Given their share of the world population, those changes have a significant impact on the overall world demographic data update.

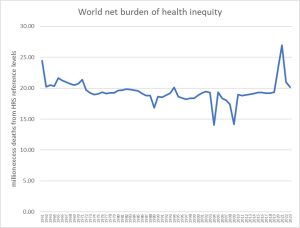
With the mentioned updated UN population data, we estimated the annual mortality rates from 1950-2023 by single year age groups and sex and the differential mortality rates with the healthy-replicable-sustainable -HRS- health (best feasible health) reference (6.6 million data each). We then applied the differential mortality rates to the reference population of each country and group and selected those in excess in each case (again 6.6 million data) to calculate the net burden of health inequity (nBHiE). The following graph represent the world´s aggregate data:

Figure 1 World net burden of health inequity

Since 1963 the number of deaths in excess from the best feasible and sustainable levels of health (shared global health objective since 1947´s WHO constitution) has been around 20 million, 20.18 million in 2023. The acute fluctuations between 2004 and 2009 relate to high adult mortality during the civil war in Sri Lanka, the HRS reference, while the peak in 2020-2021 reflect the impact of the COVID-19 pandemic.

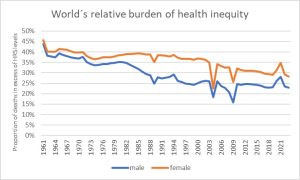
To better compare countries, age and sex groups, we calculated the proportion of all deaths that were in excess of the best feasible (HRS) levels, that is, the relative burden of health inequity (rBHiE). See rBHiE world data in the following graphs:

Figure 2 World Relative burden of health inequity 1961-2023

The graph above shows how the proportion of all deaths explained by global social/health injustice/inequity, has decreased in men from 45% in 1961 to some 25% in the 90s and remained quite stable since then, allowing for the acute fluctuations mentioned above in the nBHiE. As for women, the levels remained around 40% until the turn of the century and have decreased to some 30% in the last two decades with the mentioned fluctuations.

To calculate the human life years lost due to health inequity (LYLxHiE), we multiplied each excess death (nBHiE) by the difference of the age it took place with the HRS life expectancy at that given age group, sex, and year. The total number of life years lost due to global health inequity is represented in the following graph as well as the proportion of human life lost per person.

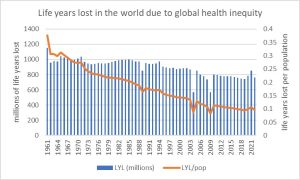
Figure 3 Life years lost in the world due to global health inequity

The representation of the life years lost due to global health inequity reveals a stable figure around 800 million since the turn of the century, with the acute fluctuations explained above. The proportion of potential human life (best feasible level) lost each year due global inequity/injustice has gradually decreased from 30% in 1961 to around 10% in 2023, as the median age of each excess death has increased due to the reduction of under five mortality in the last 62 years.

Conclusions: the recent UN population update, together with the estimates of carbon budget before we hit the 1.5º global warming enable the identification of the carbon footprint pc ethical threshold. Such carbon ethical threshold together with the world average biocapacity pc and ecological footprint serve as the ecological sustainability criteria which selects only 16 countries that have been constantly respected nature´s recycling capacity. No country with macroeconomic indicators of GDP/GNI measured in CV/PPP pc and wealth pc above world weighted average met the sustainability criteria. Among those ecologically sustainable and economically replicable countries, only one country had constantly a life expectancy at birth, both for women and men, above world average since 1961, and healthy life expectancy (deducting the burden of disability) above world average since measured in 1990. Such country is Sri Lanka, which hosts only 0,2% of the world population. Having only one HRS reference means that its fluctuations in mortality rates, as experienced during the civil war, impact the estimates of the burden of health inequity. As mentioned above, when looking at subnational regions in the 10 countries with higher population (representing 60% of the world population), we could see, only for the last 5-year period average data on life expectancy and GDP pc at CV/PPP, highly correlated with carbon emissions and ecological footprint especially when considering the consumption dimension, that 22 subnational regions representing some 6% of the world population may meet the HRS criteria. A detailed analysis of the world’s approximately 80,000 districts will likely uncover the most efficient and sustainable models rendering much higher sensitivity to the analysis of the burden of health inequity, its distribution and the identification of features (social, political, economic, cultural and environmental) that enable equitable and sustainable (fair) human well-being[xvii].


References

[i] https://www.who.int/about/governance/constitution

[ii] https://iris.who.int/handle/10665/2257

[iii] https://www.who.int/data/inequality-monitor

[iv] https://www.thelancet.com/journals/lancet/article/PIIS0140-6736(18)32072-5/abstract

[v] https://www.footprintnetwork.org/

[vi] https://www.peah.it/2024/07/13556/

[vii] Afghanistan, Burundi, Benin, Burkina Faso, Comoros, Haiti, Kenya, Cambodia, Sri Lanka, Malawi, Niger, Nepal, Pakistan, Philippines and Rwanda

[viii] India (Kerala, Nagaland), China (Shanxi, Guangxi, Anhui, Sichuan, Henan), Russia (Ingushetia, Chechnya, Kabardino, Dagestan, Karachay in the North Caucasus), Indonesia (Sulawesi, Kalimantan, Bali, Java), Pakistan (FATA), and Brazil (Piaui, Alagoas, Paraiba, Ceara, Para, Rio Grande do Norte)

[ix] https://www.peah.it/2024/09/13667/

[x] https://www.peah.it/2015/10/understanding-measuring-and-acting-on-health-equity/

[xi] https://www.binasss.sa.cr/eng.pdf

[xii] https://oxfordre.com/publichealth/view/10.1093/acrefore/9780190632366.001.0001/acrefore-9780190632366-e-62.

[xiii] https://my.editions-ue.com/catalogue/details/fr/978-3-330-86865-6/the-ethics-of-health-equity

[xiv] https://www.peah.it/2021/04/9658/

[xv] https://gobierno.uniandes.edu.co/es/Noticias/atlas-medici%C3%B3n-equidad-salud

[xvi] https://population.un.org/wpp/Methodology/

[xvii] https://www.peah.it/2023/12/12800/


—-

By the same Author on PEAH

Identifying International Sustainable Health Models 

Homo Interitans: Countries that Escape, So Far, the Human Bio-Suicidal Trend

Human Ethical Threshold of CO2 Emissions and Projected Life Lost by Excess Emissions

 Restoring Broken Human Deal

   Towards a WISE – Wellbeing in Sustainable Equity – New Paradigm for Humanity
  A Renewed International Cooperation/Partnership Framework in the XXIst Century

 COVID-19 IN THE CONTEXT OF GLOBAL HEALTH EQUITY

 Global Health Inequity 1960-2020 Health and Climate Change: a Third World War with No Guns
 Understanding, Measuring and Acting on Health Equity