IN A NUTSHELL Author's NoteThe current inequitable distribution of resources between countries results in the loss of 10% of the potential human life that could be feasible for all and sustainable within nature's cycles. In this paper, we present a stepwise approach for the logical and ethical redistribution of resources between countries that would help preserve human life, maintain natural cycles, and foster knowledge advancement toward improved wellbeing in harmony with nature. This approach involves first reallocating resources above the hoarding threshold, then addressing those above the excess threshold, thereby releasing approximately 30% of the world’s GDP that is disconnected from human wellbeing, contributes to environmental degradation, and undermines the prospects for future generations. The final step is to smooth the distribution into a normal bell curve based on equity, collaboration, and ecological balance

By Juan Garay
Professor of global health equity in Spain (ENS), Mexico (UNACH) and Cuba (ELAM, UCLV and UNAH), principal researcher of FioCruz Institute, Brazil
Ethical Equity Redistribution/Contribution to Global Good
Introduction
In previous articles and interactive SHEM webinars[i], we have identified ethical ecological thresholds for the remainder of the century[ii], developed models for healthy, replicable, and sustainable national practices[iii], examined the burden of health inequity to measure the gap from the global shared health goal[iv], and outlined the thresholds for equitable resource distribution that define the equity curve[v]. In this paper, we analyze what it would take to transform the current unjust distribution of resources—causing both intra- and intergenerational inequity and loss of life (human and other forms)—into systems that align with the universal right to health. We also explore approaches that preserve nature for future generations, reduce global work and production, and promote the advancement of knowledge to enhance human wellbeing in harmony with the environment.
Scene setting
The extreme inequalities in how humankind distributes natural resources and transforms them into goods and exchange systems are directly linked to the state of well-being, as reflected in life expectancy at birth. We have identified countries that achieve the “best feasible level of health,” meeting criteria such as higher-than-average life expectancy while relying on feasible means for all: sustainable (intergenerational) use of natural resources (planetary boundaries) and replicable levels of goods and services exchange (GDP per capita in various units). These benchmarks allow us to measure progress toward the globally shared goal of well-being and health for all nations, as outlined in the WHO Constitution (1948): the best feasible level of health for all people[vi].
The gap from this shared goal—defined as the burden of health inequity—is measured either as a net figure (number of excess deaths or life-years lost) or as a relative proportion (percentage of all deaths or population-years). Over the past 40 years, this gap has remained largely stable, with 25-30% of all deaths attributable to global injustice, resulting in the loss of approximately 10% of human life potential due to inequity[vii].
Identifying the best feasible health reference levels also enables us to define the minimum level of economic exchange capacity (GDP per capita) below which no country has achieved universal access to health or the best feasible health—a threshold we call the “dignity threshold.”[viii] This threshold is less than half the global average GDP per capita. Yet, around half the world’s population lives in countries where the national average GDP per capita falls below this dignity threshold, leaving billions deprived of the global health goal and the universal right to health measured in life years achievable for all.
This deficit, which denies over 4 billion people the opportunity to lead healthy lives, amounts to approximately 7% of the world’s economic resources. Addressing this deficit would require redistributing wealth from the top 5% population living in the GDP pc- richest nations—those with GDP per capita levels more than five times the world average and over ten times the dignity threshold. We refer to this upper limit as the “hoarding threshold.” Redistribution from hoarding to deficit is a critical first step toward achieving economic and health equity and justice.
However, the global average GDP per capita is itself unsustainable in terms of natural resource consumption. We have identified the resource levels that enable the best well-being and health outcomes (highest levels of life expectancy at birth), even if not universally replicable or sustainable. Some subnational references demonstrate that maximum well-being requires no more than twice the world average economic exchange (GDP per capita). Beyond this level, well-being does not improve further—referred to by some as “wasted GDP”[ix]—and continued economic excess accelerates environmental destruction and undermines future generations (hence becoming “toxic GDP”[x]). We term this upper boundary the “excess threshold.”
Ensuring the best feasible health for all humans, including future generations, hinges on the principle that no one should have more than is necessary to enjoy the highest levels of well-being and lifespan. Fair societies and nations require living within equity margins—from the dignity threshold to the excess threshold. Achieving this would reduce the world’s GDP (production, trade, consumption, speculation) by 30% while increasing 10% human life and wellbeing and preserving those levels for coming generations by respecting and caring for nature. Moreover, such equitable and sustainable degrowth could direct 10% of economic resources toward the collective advancement of knowledge (independent of market dynamics) -over 10 times the present levels[xi]-and reduce one-fifth of the time and energy spent on working, producing, and consuming (as some countries are beginning to consider[xii]), improving progressively and in a sustainable way human wellbeing in our shared planet.
What does this vision require?
We must first understand the current distribution of economic resources and design redistributive systems that lead to global equity and justice. The calculations and graphs presented here aim to define these pathways.
World present levels of distribution of resources
We analyze the distribution of resources among countries by levels of GDP per capita (GDP pc), which reflects the means and capacity to access and control natural and manufactured goods and the services associated with them.
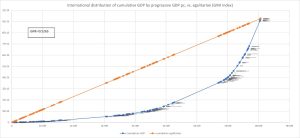
The graph below shows the cumulative population (horizontal axis) and GDP (vertical axis) of all countries in 2023, arranged from the lowest to the highest GDP pc. This distribution is compared to a hypothetical egalitarian scenario, where all individuals would have equal economic means. The gap between the two curves represents the Gini index[xiii], a measure of inequality: it would be zero in a perfectly equal society and one if all resources were concentrated in a single entity. Currently, the global GDP Gini index stands at 0.52, indicating that the world is more than halfway to complete inequality.
Each dot on the graph represents a country. The horizontal length corresponds to its population (with India and China being the largest), and the steepness of the curve reflects the country’s economic capacity or use, which increases with GDP pc. GDP pc ranges from the lowest in Burundi ($262 per capita) to the highest in Monaco ($218,375 per capita)—a difference of 833 times.
Figure 1 Current international GDP distribution vs egalitarian model, Gini index 2023
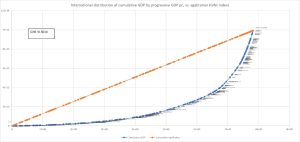
Given the large variation in the population size of countries, we have disaggregated data in the three largest countries in terms of population – India, China and the USA-. The resulting curve is displayed below. As disaggregation evens the differences between the mentioned countries and the rest, the Gini index is reduced to 0.50. Higher levels of disaggregation applied to all countries would smooth the curve of cumulative income and slightly reduce the Gini index, as we will later see with the normal distribution, even if skewed, the tendency of any distribution.
Figure 2 International Gini curve with disagregation by subnational data form India, China and the USA, 2023
While the Gini index decreases with higher disaggregation of Population/GDP pc/GDP in the three largest countries, the range also increases, with lowest GDP pc still in Burundi and highest in Columbia/USA, with 263,220 $ GDP pc, that is, over a thousand times higher than the lowest national average. Interestingly Columbia state/ Washington DC, has concentrated as well the highest political and military power in the world in the last 60 years.
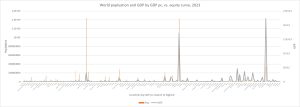
Figure 3 Distribution of population and GDP by countries listed by GDP pc levels, 2023
The graph above displays the distribution of the population (orange bars) and GDP (grey line) by country, from lowest to highest GDP pc. It shows a clear disconnect between people in the mid and left side, and the majority of resources, concentrated in the right side, with the highest peak corresponding to the USA.
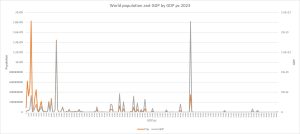
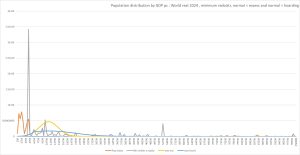
When plotted by the levels of GDP pc, as below, the graph is even more telling, with a large share of the population (orange line) below 12,000 $ GDP pc and a large share of the GDP above $50,000, with countries in the “far right” with low shares of the world´s population yet concentrating high GDP shares. As we plot here countries´ population and GDP, the three main peaks are with India (much lower GDP than the proportionate population), China (both quite even -as China´s GDP pc is very close to the world average) and the USA (with much higher GDP share than its population).
Figure 4 Distribution of international population and GDP by GDP pc intervals, 2023
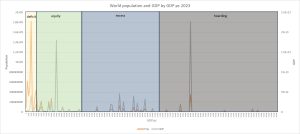
The graph below includes the relation of the above representation of the international population and GDP, with the 2equity zones” defined by the above-mentioned thresholds: deficit, equity, excess and hoarding.
Figure 5 Relation of world´s population and GDP with equity zones and thresholds, 2023
The graph above illustrates the deficit zone, below 3880$ GDP pc with the high population peak of India; the countries in the equity range (above the dignity threshold and below the excess threshold of 21,838 $ GDP pc), with the China population and GDP peak at the center, the excess zone (between the excess and hoarding thresholds) with lower peaks of population yet higher in GDP (mostly European countries, Canada and Japan) and the hoarding zone (with GDP pc above 52977 $), with the high GDP peak of the USA and spread out of other smaller countries in population concentrating resources at the far right.
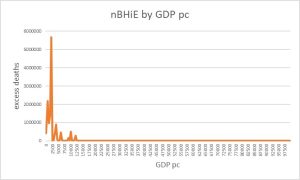
Figure 6 Excess deaths (net burden of health inequity) by national average GDP pc intervals, 2023
As mentioned in the introduction, the distribution of the people in the world according to their national average GDP pc is related to the loss of human life. The above graph depicts the levels of excess deaths (net burden of health inequity) by country, with almost 90% of them taking place in the deficit zone, with GDP pc below the dignity threshold.
So, what would the world require as economic flows/redistribution between countries to enable a humanity in equity saving lives, the planet and preserving and improving the living conditions of coming generations?
Redistribution flows towards sustainable equity
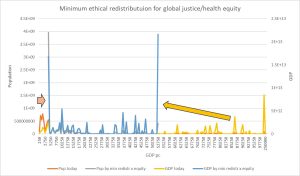
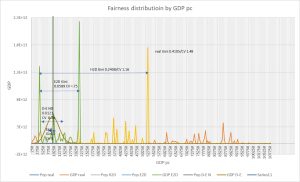
The graph below shows how the international distribution of average GDP pc would look like if the countries in the hoarding zone[1] would redistribute their GDP pc above the hoarding threshold of 52,977$ GDP pc to the countries in the deficit zone below 3,880 $ GDP pc. It would result in a distribution of the world population between dignity and hoarding levels, with three peaks of population: some half of the world population with the dignity GDP pc, a peak around the middle representing China´s close to 20% of the world´s population and a peak of some 5% of the world population yet with, even after redistribution, a quarter of all world´s economic capacity.
Figure 7 Redistribution from current to hoarding-to-deficit redistribution, by countries' population and GDP according to GDP pc levels
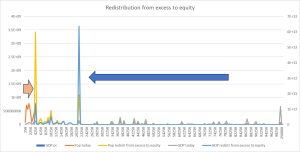
The following step would be to redistribute the unnecessary-for-wellbeing excess GDP pc (above 21,838 $ GDP pc) to the equity zone. The graph below represents that scenario where besides all countries having at least average GDP pc above the dignity threshold, a billion people (one in eight) would have the same excess GDP pc threshold levels, and concentrate some 20% of the world´s resources vs. the present share of half of the world´s income, and wealth. Currently, more than half of the GDP in the excess and hoarding zones is effectively “wasted”—providing no additional benefit to human wellbeing—and “toxic,” as it perpetuates inequality (by denying dignified living conditions to half the world’s population) and causes significant environmental harm (through excessive carbon emissions and ecological degradation).
Figure 8 Redistribution from current to excess-to-deficit redistribution, by countries' population and GDP according to GDP pc levels
The graphs above are artificially clustered around peaks due to the use of national average concentrations, particularly for the largest countries. As shown in the earlier graphs, disaggregating the data further—by subnational regions, districts, communities, and individual GDP per capita levels—would smooth the distribution curve, shifting it closer to a normal bell-shaped curve, albeit skewed. This skewness, as the graphs predict, would be heavily biased to the right, reflecting the concentration of resources among a small minority.
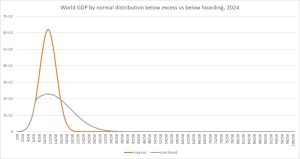
Figure 9 Normal distribution of the world´s population by countries ‘GDP pc after H2D and E2D redistributions
The graph above illustrates how the normal distribution would appear in the two redistribution scenarios described: Hoarding to Deficit (H2D) and Excess to Deficit (E2D), while maintaining the current world average GDP per capita. In the H2D scenario, the midpoint between the dignity and hoarding thresholds would be significantly higher than the present world GDP per capita average, resulting in a curve that is strongly skewed to the right. In contrast, the redistribution curve for the dignity-to-excess scenario would have its midpoint closer to the current global average GDP per capita. This would create a distribution that is nearly symmetric, and it could even become slightly skewed to the left if the average GDP per capita were reduced. This reduction would occur as GDP above the excess threshold is redistributed to the deficit zone. The process would eliminate wasted and toxic GDP, allowing for a global reduction in working days and hours (currently tied to competitive systems of education, labor, production, trade, and consumption) while still enabling a fivefold increase in investment toward advancing knowledge. Crucially, this approach would shift focus from competition to collaboration, converting extreme profits and patents into global public goods[xiv].
Figure 10 Current, H2D, E2D and their normal distributions, of international population and GDP by GDP pc levels
Based on the analysis above, we can represent the current distribution of the world’s financial exchange capacity—closely correlated with wealth, typically averaging five times the GDP per capita—and the resulting redistribution curves. These curves reflect the reallocation of wasted/toxic GDP from hoarding and excess zones to the deficit zone, as depicted in the graph above.
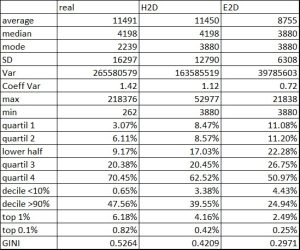
The following table provides a summary of the central and dispersion measures for the current distribution, as well as for the Hoarding-to-Deficit (H2D) and Excess-to-Deficit (E2D) redistribution scenarios.
Table 1 Central and dispersion measures of current, H2D and E2D international distribution of resources
The data reveal that, under the Excess-to-Deficit (E2D) model, the average GDP per capita could decrease by 23.8%, which would help reduce working hours globally while facilitating the advancement of collective knowledge and promoting human wellbeing in harmony with nature. The dispersion measures indicate that the standard deviation, coefficient of variation, range, and ratio of extreme values, as well as the Gini index, would all gradually decrease. This shift would make the distribution of GDP per capita more even across different population percentiles.
Currently, the highest GDP per capita is more than 800 times higher than the lowest (over 1,000 times if disaggregated at subnational levels), and the wealthiest 10% of countries control almost half of the world’s income and wealth. Meanwhile, the poorest half of humanity has access to less than 10% of global wealth and economic exchanges. This extreme inequality would progressively change through a logical (minimizing wasted GDP) and ethical (redirecting from hoarding and excess to deficit and wellbeing) approach. In this new scenario, the ratio between the highest and lowest GDP per capita would be 5.6 times, and the wealthiest 10% of countries would retain significant advantages, though limited to a quarter of the world’s total income and wealth. The poorest half would then gain access to 22% of global income and wealth.
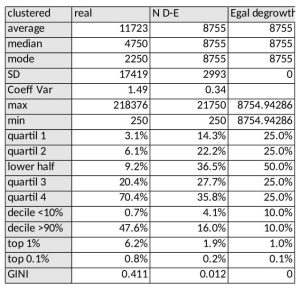
The table below further explores how redistributing resources within the excess to deficit thresholds could smooth the distribution, shifting it from a bipolar shape (where half of the world’s resources are concentrated at both extremes of the equity curve) to a bell-shaped normal distribution. This trend could continue toward an egalitarian (utopian?) distribution, where disparities in property and social hierarchies would disappear, and all individuals would have equal means to enjoy life and contribute to the common good while living in balance with nature.
Table 2 Central and dispersion measures of current, E2D and normal E2D normal distribution of international GDP
As shown in the table above, grouping GDP per capita into intervals to compare current and redistribution scenarios reduces the current Gini index to 0.41 by merging values in $500 per capita intervals. In the transition from the Excess-to-Deficit (E2D) scenario toward a normal bell-shaped distribution, the concentration of half the population at the dignity threshold level would expand proportionally towards the global (reduced) average GDP per capita, while GDP clusters around the excess threshold would shift to the upper half above the world’s average GDP per capita.
A normal, equitable distribution of income and wealth would share the range and ratio seen in the E2D redistribution scenario, while significantly decreasing the standard deviation and coefficient of variation to less than four times their current levels. The Gini index would drop to 34% of its current value, and be 24% lower than in the E2D model. Under this distribution, the wealthiest 10% would hold 16% of global resources, while the poorest half of the population would gain access to over one-third of the world’s income and wealth.
In an egalitarian utopian distribution, there would be no dispersion from the mean; all individuals would have equal means. The proportion of the population and the distribution of income and wealth would be perfectly balanced.
The graphs below show again the distribution of humanity´s resources in the present and progressive fairness phases and their dispersion measures.
Figure 11 International current and refdistribution schemes with central and dispersion figures
Fiscal and territorial equity
How can resources be redistributed in phases to promote fairness, reduce preventable loss of human life (the burden of health inequity), and gradually allocate time and knowledge toward enhanced human wellbeing while maintaining balance with nature?
As long as humanity remains attached to borders, property ownership, and hierarchical structures, achieving equitable redistribution of income and wealth will require both fiscal and territorial equity measures.
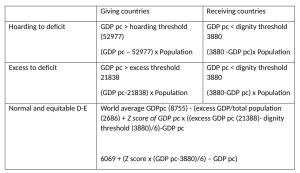
The table below illustrates the redistribution needed between countries in 2024:
The fiscal and territorial cohesion strategies require identifying the dignity, excess, and hoarding thresholds, the world GDP per capita average after excess-to-deficit redistribution, and the Z score of the current GDP per capita level (indicating how many standard deviations the GDP per capita is from the mean).
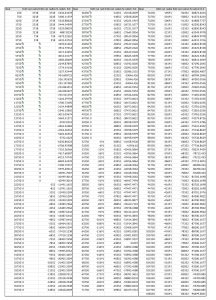
Annex 1 provides the per capita receiving or giving levels within different GDP per capita ranges.
The equitable redistribution model described can be implemented at local, subnational, national, and international levels. The more granular the geographic and demographic breakdown, the greater the sensitivity in identifying more health- and wellbeing-efficient and sustainable lifestyles and economies. With smaller sample units and larger sample sizes, the identification of wasted or toxic GDP increases, enhancing the capacity for equitable redistribution and freeing up time from competitive production. This, in turn, supports collaborative advancements in knowledge[xv] that promote human wellbeing while maintaining ecological balance.
We recognize that the analysis presented here may sound utopian, especially given that even the UN agreement aimed at preventing tax abuse by large corporations and saving half a trillion dollars is being blocked by wealthy nations[xvi]. Currently, there are no benchmarks or indicators for subnational and international fiscal equity. In response, we propose a system based on logical and ethical principles that could help develop international targets and indicators. This would address the gaps in existing UN conventions on fiscal equity, fair international redistribution (which is currently far below the first step of the Global Health 2 Development (GH2D) benchmark), and the provision of global public goods.
Conclusions
The analysis presented in this paper underscores the urgent need for an ethical and equitable redistribution of global economic resources to foster well-being, environmental sustainability, and intergenerational equity. By reallocating excess resources from high-income nations and reducing the economic disparities between nations, we can approach a system where the greatest number of people can achieve health and life expectancy aligned with the shared global goal outlined in the WHO Constitution.
Our proposed approach would first prioritize the redistribution of wealth above the hoarding threshold, addressing the economic excess concentrated within the wealthiest segment of nations, and redirecting it toward the deficit zone, where billions live below the dignity threshold. This redistribution could effectively release significant economic resources, reduce global economic and social inequality, and decrease the burden of preventable deaths caused by poverty.
Second, the model calls for the reallocation of resources above the excess threshold (above which human wellbeing does not improve any further) to the equity zone, thereby achieving a more balanced and sustainable economic structure. The scenario outlined illustrates how this stepwise redistribution can decrease the global GDP’s concentration of wealth, diminish the Gini index, and reduce income dispersion, making economic distribution more equitable and less skewed toward extreme wealth concentration.
The envisioned equitable distribution also aligns with the potential for a sustainable reduction in the global work and consumption burden. This transition would foster more harmonious relationships between economic activity, environmental sustainability, and human well-being. Furthermore, redirecting a portion of GDP currently “wasted” or “toxic” into collective knowledge and public goods can drive innovation and long-term societal progress.
The implications of these findings extend beyond economic redistribution; they challenge traditional paradigms of growth and competition, promoting cooperation, ecological balance, and shared prosperity. Realizing this vision would require robust fiscal and territorial policies, alongside global cooperation to ensure that the dignity threshold is met for all while curbing excessive consumption and environmental impact.
In sum, transitioning to an equitable and sustainable economic model, as proposed, can enable a profound shift in how societies prioritize human potential, ecological sustainability, and the collective future of our shared planet. Through careful, ethical redistribution of resources, we can address the loss of life due to inequity, support future generations, and foster a world where all individuals have the opportunity to lead fulfilling, healthy lives in balance with nature.
Annex 1: redistribution pc by present GDP pc levels
Footnote
[1] Monaco, Liechtenstein, Bermuda, Luxembourg, Ireland, Isle of Man, Switzerland, Cayman Islands, Gibraltar, Norway, Qatar, Singapore, United States, Channel Islands, Faroe Islands, Australia, Denmark, Iceland, Macao SAR, Sweden and Greenland
References
[i] https://www.sustainablehealthequity.org/webnair
[ii] https://www.peah.it/2024/07/13556/
[iii] https://www.peah.it/2024/10/identifying-international-sustainable-health-models/
[iv] https://www.peah.it/2024/11/the-price-of-global-injustice-in-loss-of-human-life/
[v] https://www.peah.it/2024/11/enough-is-enough-and-more-is-too-much-between-basic-dignity-and-excess-hoarding-thresholds/
[vi] https://www.who.int/about/governance/constitution
[vii] https://www.peah.it/2024/11/the-price-of-global-injustice-in-loss-of-human-life/
[viii] https://www.peah.it/2024/11/enough-is-enough-and-more-is-too-much-between-basic-dignity-and-excess-hoarding-thresholds/
[ix] https://www.nature.com/articles/s41599-023-02210-y
[x] https://www.peah.it/2023/12/12800/
[xi] https://prosperitydata360.worldbank.org/en/indicator/UN+SDG+GB+XPD+RSDV+GD+ZS
[xii] https://www.euronews.com/next/2024/02/02/the-four-day-week-which-countries-have-embraced-it-and-how-s-it-going-so-far
[xiii] https://databank.worldbank.org/metadataglossary/gender-statistics/series/SI.POV.GINI
[xiv] https://www.sciencedirect.com/topics/social-sciences/global-public-goods
[xv] https://open-science-training-handbook.github.io/Open-Science-Training-Handbook_EN/02OpenScienceBasics/03OpenResearchSoftwareAndOpenSource.html
[xvi] https://taxjustice.net/press/world-losing-half-a-trillion-to-tax-abuse-largely-due-to-8-countries-blocking-un-tax-reform-annual-report-finds/
—
By the same Author on PEAH

Enough is Enough, and More is Too Much: Between Basic Dignity and Excess/Hoarding Thresholds

Geography of Global Injustice: State of the Burden of Global Health Inequity in 2023

The Price of Global Injustice in Loss of Human Life

Identifying International Sustainable Health Models

Homo Interitans: Countries that Escape, So Far, the Human Bio-Suicidal Trend

Human Ethical Threshold of CO2 Emissions and Projected Life Lost by Excess Emissions

 Restoring Broken Human Deal

   Towards a WISE – Wellbeing in Sustainable Equity – New Paradigm for Humanity

  A Renewed International Cooperation/Partnership Framework in the XXIst Century

 COVID-19 IN THE CONTEXT OF GLOBAL HEALTH EQUITY

 Global Health Inequity 1960-2020 Health and Climate Change: a Third World War with No Guns

 Understanding, Measuring and Acting on Health Equity
