The Karnataka Multisectoral Nutrition Pilot Project, led by the Karnataka Comprehensive Nutrition Mission was implemented in Devadurga Block, Raichur District and Chincholi Block, Gulbarga District, two most backward Blocks in Karnataka, India, between 2015-2018. Interventions were inter-sectoral and intergenerational and addressed root causes of malnutrition. This paper analyses real time data that emerged from the project regarding underweight, stunting and wasting among 8606 children in the cross-sectional group and 699 children in the cohort group aged 6 months to 3 years. Data indicates that percentage of ‘normal children’, that is, not underweight, wasted or stunted, increased by 9 percentage points from baseline to endline; underweight reduced by half and wasting by almost two-thirds. Stunting increased by one percentage point, with previously wasted and underweight children transitioning into stunting, while around one-third baseline stunted children became non-stunted. This constant transition between the three anthropometric indicators suggests that they impact each other constantly and coexist simultaneously in different combinations as children grow. Hence, policy and programmes for addressing/preventing them, should view them in an integrated, holistic manner
By Veena S Rao[1], Shalini Rajneesh[2], Chaya Degaonkar[3], Hanimi Reddy[4], S Bharadwaj[5]
Multisectoral Nutrition Interventions: Impact and Transitions in Undernutrition, Stunting and Wasting in Children
An Open Experiment in Two Remote Blocks of Karnataka, India
Supported by Karnataka Evaluation Authority, Department of Planning, Programme Monitoring and Statistics, Government of Karnataka
Introduction
The Karnataka Multisectoral Nutrition Pilot Project (KMNPP) was implemented under the leadership of the Karnataka Comprehensive Nutrition Mission (KCNM) which was announced by the State Government in 2010.
The Mission Strategy, which was intersectoral in nature, was finalized in January 2011, after high level consultation with experts from Government, nongovernmental and international organizations.[6]
The strategy was piloted successfully in Gubbi and Shikaripura Blocks between 2011 and 2014. In July 2014, the Government of Karnataka received a grant of USD 4.55 million from the World Bank/JSDF Trust Fund, for replicating the strategy in two of the most backward Blocks in Karnataka – Devadurga Block, Raichur District and Chincholi Block, Gulbarga District. Chincholli Block has a total population of 2,54,287 and has 136 villages. The total population of Devadurga Block is 2,80,606 with 173 villages. The human development indicators of these two Blocks are among the worst in Karnataka. Devadurga is ranked 176 out of 176 taluks and Chincholli is ranked 173 out of 176 taluks. [7]
Box 1: Nutrition Indicators of India, Karnataka, Raichur and Gulbarga Districts
| Nutrition Indicators |
India |
Karnataka |
Raichur |
Gulbarga |
| Infant Mortality Rate (IMR) |
41* |
26.9*
25.4** |
NA |
NA |
| Maternal Mortality Rate (MMR) |
113*** |
92*** |
NA |
NA |
| Stunting % (Children below 5 years of age) |
35.8 * |
36.2*
35.4** |
37.2*
39.8** |
52.2 *
34.5** |
| Wasting % (Children below 5 years of age) |
21.0 * |
26.1*
19.5** |
23.2*
34.9** |
34.0*
25.0** |
| Underweight % (Children below 5 years of age) |
38.4 * |
35.2 *
32.9** |
41.2*
40.7** |
56.7*
36.2** |
| Infants 6-23 months receiving adequate Diet % |
9.6*
|
8.2*
12.8** |
3.3*
13.0** |
2.6*
15.4** |
| Anaemia among women aged 15-49 years % |
53.1 *
|
44.8*
47.8** |
58.7*
60.4** |
43.1 *
56.0** |
| Anaemia among children age 6-59 months % |
58.6*
|
60.9*
65.5** |
70.6*
73.6** |
72.4*
75.1** |
| Anaemia among women aged 15-19 years % |
— |
44.8*
47.8** |
62.2*
64.8** |
61.4*
46.6** |
| Anaemia among Pregnant women aged 15-49 years % |
50.4 |
45.4*
45.7** |
73.1*
69.1** |
53.9*
58.0** |
| Body Mass Index (BMI) is below normal (BMI <18.5 kg/m2) among Women aged 15- 49 years % |
22.9*
|
20.7*
17.2** |
20.8*
23.3** |
22.5*
20.8** |
| Female literacy Rate (15-49 years)% |
68.4*
|
71.7*
76.7** |
54.3** |
68.2** |
Source: * NFHS 4 (2015-16) ** NFHS 5 (2019-20) *** SRS Bulletin (2016-18)
On account of the intrinsic inter-sectoral nature of the projects, they would be operated through the Karnataka State Rural Livelihoods Promotion Society (KSRLPS), Department of Rural Development, under the technical guidance of the Karnataka Comprehensive Nutrition Mission.
Implementation of the Pilot Project started in July 2015, after receiving necessary approval and selection of the implementation partner NGO, Karnataka Health Promotion Trust
Unique Features of the Strategy
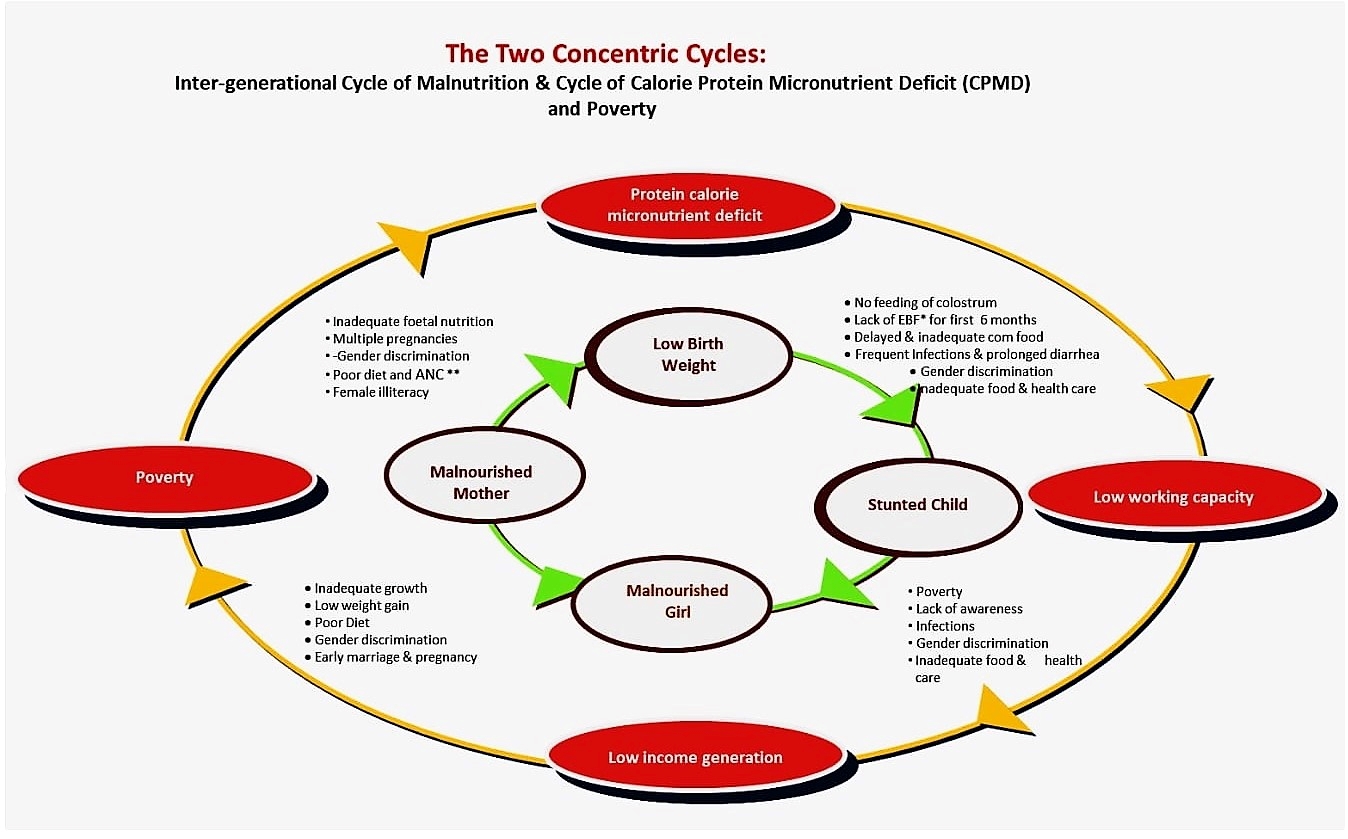
The pilot project interventions aimed at addressing the root causes of malnutrition in India, viz.,
- Directly addressing the inter-generational cycle of malnutrition by simultaneous targeting and addressing the nutritional needs of infants, children, adolescent girls and pregnant and nursing mothers.
- Bridging the information deficit through a sustained, multi-layered general public awareness campaign, most importantly through interpersonal communication, to reach the general public, focusing at the household level, regarding proper nutritional practices within existing family budgets and proper child, adolescent and maternal care, and creating demand for on-going government programmes.
- Bridging the calorie-protein micronutrient deficit among the inter-generational target groups by providing appropriate fortified multigrain energy food supplementation for consumption.
- Accelerating, integrating and tightly monitoring multi-sectoral ongoing programmes that have impact on malnutrition, such as Immunization and Vitamin A Supplementation, Anaemia Control, Water and Sanitation, etc., and achieving convergence between the ongoing programmes so that they operate simultaneously, and filling programmatic gaps.
- Increasing programme coverage by demand creation through involvement of the community, NGOs, SHGs and VPs.
- Making available low-cost energy foods for the general population.
- Real time monitoring of the beneficiaries’ nutrition indicators, particularly regarding underweight, stunting and wasting of children, body mass index of adolescent girls, pregnancy weight gain, and incidence of low birth weight babies
It is important to note that the Karnataka Multisectoral Nutrition Pilot Project (KMNPP) was not a supplementary food programme alone. It was a comprehensive programme that began with an intensive behaviour change communication campaign. It then proceeded to bridge the nutritional dietary gap for the targeted groups, namely, infants below 3 years, adolescent girls, and pregnant women. Low cost fortified energy food produced from locally available agricultural produce, specifically formulated for the three inter-generational target groups was produced by women from local Self Help Groups (SHGs) working in Production Units set up during the first year of the project. This component was supported by Global Alliance for Improved Nutrition (GAIN)
Selection of beneficiaries
Beneficiaries were shortlisted through a Gram Sabha (Village Assembly) where the poorest families of the village were selected. The selection criteria used was on the basis of certain auto-inclusion, deprivation and nutrition indicators regarding annual income per family, source of livelihood, land owned per family, food intake and nutritional status. Children below the age of 36 months, adolescent girls between 11-18 years of age, and pregnant and lactating women who fell within the most deprived 40% of the population were selected.
Beneficiaries registered at the start of the project-
| Block |
Children
0-5 months |
Children
6-35 months |
Adolescent girls 11 to 18 years |
Pregnant women |
Lactating mothers |
Total |
| Chincholi |
417 |
6038 |
8107 |
783 |
1660 |
17005 |
| Devadurga |
152 |
6522 |
8396 |
841 |
2090 |
18001 |
| Total |
569 |
12560 |
16503 |
1624 |
3750 |
35006 |
Project Interventions at Preparatory Stage (July 2015-September 2016)
A Village Nutrition Volunteer (VNV) was appointed in each village by the partner NGO and trained. The Training Module was provided by the KCNM. The VNVs were trained to ensure accuracy for measuring the weight and height of infants, children, adolescent girls and pregnant women. The responsibilities of the VNV consisted of all the critical essential interventions required for improving nutritional status of families/communities, but were presently not part of any on-going programme. These were mainly, household counselling and counselling for mothers and adolescent girls for behavior change regarding proper affordable diets, personal hygiene, proper storage of water in the household, the importance of sanitation, basic principles of the inter-generational cycle of malnutrition, proper child care practices, the importance of adolescent girls’ nutritional and health care, of pregnancy care and proper weight gain and the negative impact of malnutrition on the lives of people. The VNV also explained through counselling the importance of nutrition impacting programmes, such as, immunization, IFA, sanitation and creating demand for them. The VNV was provided simple household level IEC on the subjects to strengthen the household counselling sessions. For details, please see link below.[8]
The VNV thus supplemented the responsibilities by the Anganwadi Worker[9] and ASHA worker[10], and the three of them worked well as a team, calling themselves the three sisters.
The VNV’s first task was to create Nutrition Cards for all beneficiaries in which nutrition indicators, such as age, height, weight and other indicators specific to each target group, eg., for children- whether the child was exclusively breast fed for the first six months, when was complementary feeding started, diarrhea episodes, immunization status, Vitamin A doses, details of sanitation and safety of drinking water and its storage in the household, were recorded.
There was a monthly recording of height and weight for children. For adolescent girls, weight was recorded every month, and height was recorded every quarter. Monthly monitoring meetings were held by the NGO partner at village and block levels and bi-monthly reviews were held by KCNM at mission level. For infants, details about immunization, exclusive breast feeding, initiation of complementary feeding, diarrheal episodes were continuously recorded and monitored. For pregnant/lactating women there was monthly weight monitoring, and counselling regarding additional diet and proper pregnancy weight gain, and consumption of Iron and Folic Acid tablets. For adolescent girls, quarterly height and weight measurements, school attendance, and consumption of Iron and Folic Acid tablets were recorded and monitored. The VNV visited every beneficiary household at least once a month, and more often if required in case of illness or emergency.
A strong multi layered IEC campaign was created by KCNM which aimed at bringing about behaviour change regarding proper nutritional and health practices, dietary diversification, within the family and community, and within their household budgets, particularly regarding care of children, adolescents, and pregnant and lactating women.
SHGs were strengthened, and empowered through information and awareness on nutrition and health so that they could be active participants in bringing about behaviour change.
VNVs motivated and assisted the families to apply to Panchayats for construction of toilets in their homes. After Mission intervention in October 2016, 6989 toilets have been constructed and are being used – (3347 in Chincholi and 3642 in Devadurga Blocks) as at the end of June 2018.[11]
Real Time Monitoring: The Project was vigorously monitored at the Mission and community levels. Data from Nutrition Cards was compiled, reviewed and monitored at field level by the NGO field workers, and at the Mission level on a real time basis.
The core activity in the project was the regular house to house counseling regarding essential health and nutritional messages, both before and after supplementary nutrition started. The VNV visited every beneficiary household at least once a month, and was available on call if there was any special or urgent request from any beneficiary family in the village. To prevent information overload and to ensure that the messages start getting absorbed by the families in a sustained manner, they were disseminated in phases, through household counseling, through flipcharts and charts, through radio and Cable TV and through wall paintings.
Details and phases of the multi layered IEC campaign are available at the link below.[12]
Box 2 below provides timelines and key milestones of the implementation of the Pilot Projects.
Box 2- Key milestones implementation timelines
| Key Milestones |
Devadurga |
Chincholi |
| Selection of NGO Implementation partner |
2015 |
2015 |
| Baseline survey |
December 2015 |
December 2015 |
| Selection, training and placement of Village Nutrition Volunteers
Selection of beneficiaries
Development of IEC material |
2015 |
2015 |
| Setting up of production units |
2016 |
2016 |
| Monthly/Quarterly monitoring of anthropometric and other measures of all beneficiaries in all villages |
September 2016, till September 2018 |
September 2016, till September 2018 |
| Motivation for construction and use of toilets |
October 2016 onwards |
October 2016 onwards |
| Regular house to house counselling regarding essential health and nutritional messages |
|
|
| · Phase 1 – Communication messages |
April-2016 |
April-2016 |
| · Phase 2 – Communication messages |
February-2017 |
February-2017 |
| · Phase 3 – Communication messages |
August-2017 |
August-2017 |
| Consumption of fortified energy food by beneficiaries |
December-2016 |
October-2016 |
(Details regarding the implementation of the pilot projects are available at http://karnutmission.org.in)
In terms of real time monitoring, the period between December 2015 to September 2016 is considered as ‘preparatory phase’ as systems were being setup, field staff was being appointed and trained, beneficiaries in all project villages were being selected, and Nutrition Cards with indicators were being filled up. The next two years (October 2016 – September 2018) may be treated as ‘implementation phase’. Implementation phase may further be divided into two major parts – from December 2015 to September/November 2016 as only ‘Information Education and Communication (IEC)’ phase and November 2016/January 2017 until September 2018 as ‘IEC + supplementary nutrition’ phase.
The present paper presents the data and analyses the outcomes of the Karnataka Multi-Sectoral Nutrition Pilot Project interventions on three undernutrition indicators of stunting, wasting and underweight among a cross-section of children aged 6-35 months, and in a cohort of children, and the changes and transitions of these indicators among them, between the time period September 2016 (baseline) and September 2018 (end-line), as the interventions progressed in the project area.
Project Design
This study has used a natural experimental design, consisting of cross-sectional baseline and end-line survey of the entire number of 6–35-month-old children who came within the project at any time and left at any time between September 2016[13] to September 2018. The data emerging during the transition process for this cross sectional group of children has been analysed at seven points in time. (Table 2) We also identified a cohort of 699 children who were beneficiaries of the project continuously from September 2016 until September 2018, from a mean age of 9.6 months to 33.6 months. The anthropometric data of this group of children has been analysed at six points in time.
DATA COLLECTION
Baseline data for this study was finalized after completion of the preparatory stage of the project between December 2015 to September 2016. As the project was a natural experiment, where all children in the age group of 6-36 months could enter and exit at anytime, the number of children registering from inception till conclusion varied. The total number of children who had enrolled at any time during the project period was 28,599. Of these, 5511 children formed the cohort group and the remaining 23,088 children constituted the cross-section group. After eliminating cases of erroneous and missing data, the number of children in cohort group with correct and complete data reduced to 699 and number of children in cross- section group reduced to 8606. Seasonal migration of families for employment during the agricultural lean season, is another reason for missing data for children.
|
Total number of children registered |
Total Cohort Group September 2016 to 2018 |
Total Cross-sectional group September 2016 – 2018 |
| Children with complete data used for analyses |
9305 |
699 |
8606 |
| Children with incomplete/incorrect data – not used for analyses |
19294 |
4812 |
14482 |
| Total |
28599 |
5511 |
23088 |
Background information about every child, date of birth, caste, gender, type of delivery (home/institutional), birth weight, details about initiation of breast feeding, introduction of complementary feeding were collected and recorded in the child’s Nutrition Card. The date of the VNV’s visit, and follow-up data including age (in completed months), weight (in kilograms), height (in centimetres) was recorded, on a monthly basis along with data regarding, immunization, diarrhoea episodes, and other illnesses. Infantometers were used to measure the length of infants, and digital scales for measuring the weight of infants, children, adolescents and adults. Height of children who could stand and adolescent girls was taken with a measuring tape against a wall. All the follow-up data was cleaned for outliers and missing information and all records with missing data for age and weight and height were excluded from the analysis. For the cleaned data, the anthropometric measures were calculated using WHO 2007 ‘Anthro Software Stata’ version for less than 36-month-old children.
The primary outcomes for the program in this paper are the three undernutrition measures of stunting, wasting and underweight among children aged 6-36 months. Severity of these three outcome variables are classified as moderate (below -2 standard deviations) or severe (below -3 standard deviations) or normal (children without moderate or severe condition), by using WHO child growth standards median (WHO, 2009).
All analysis was done using SPSS statistical software package version 22 and Stata version 14. Socio-economic and demographic characteristics about the two project blocks were mainly obtained from the tables of primary census abstract of the two blocks according to 2011 census. Changes in child nutrition outcomes at different periods of follow-up were measured as percent changes in the measure as compared to the baseline values, and the significance was estimated using Fisher’s exact Chi-square test. Significance of change in outcome measures was presented at p value <0.05, <0.005 and <0.0005 levels.
Results: Cross Sectional Group
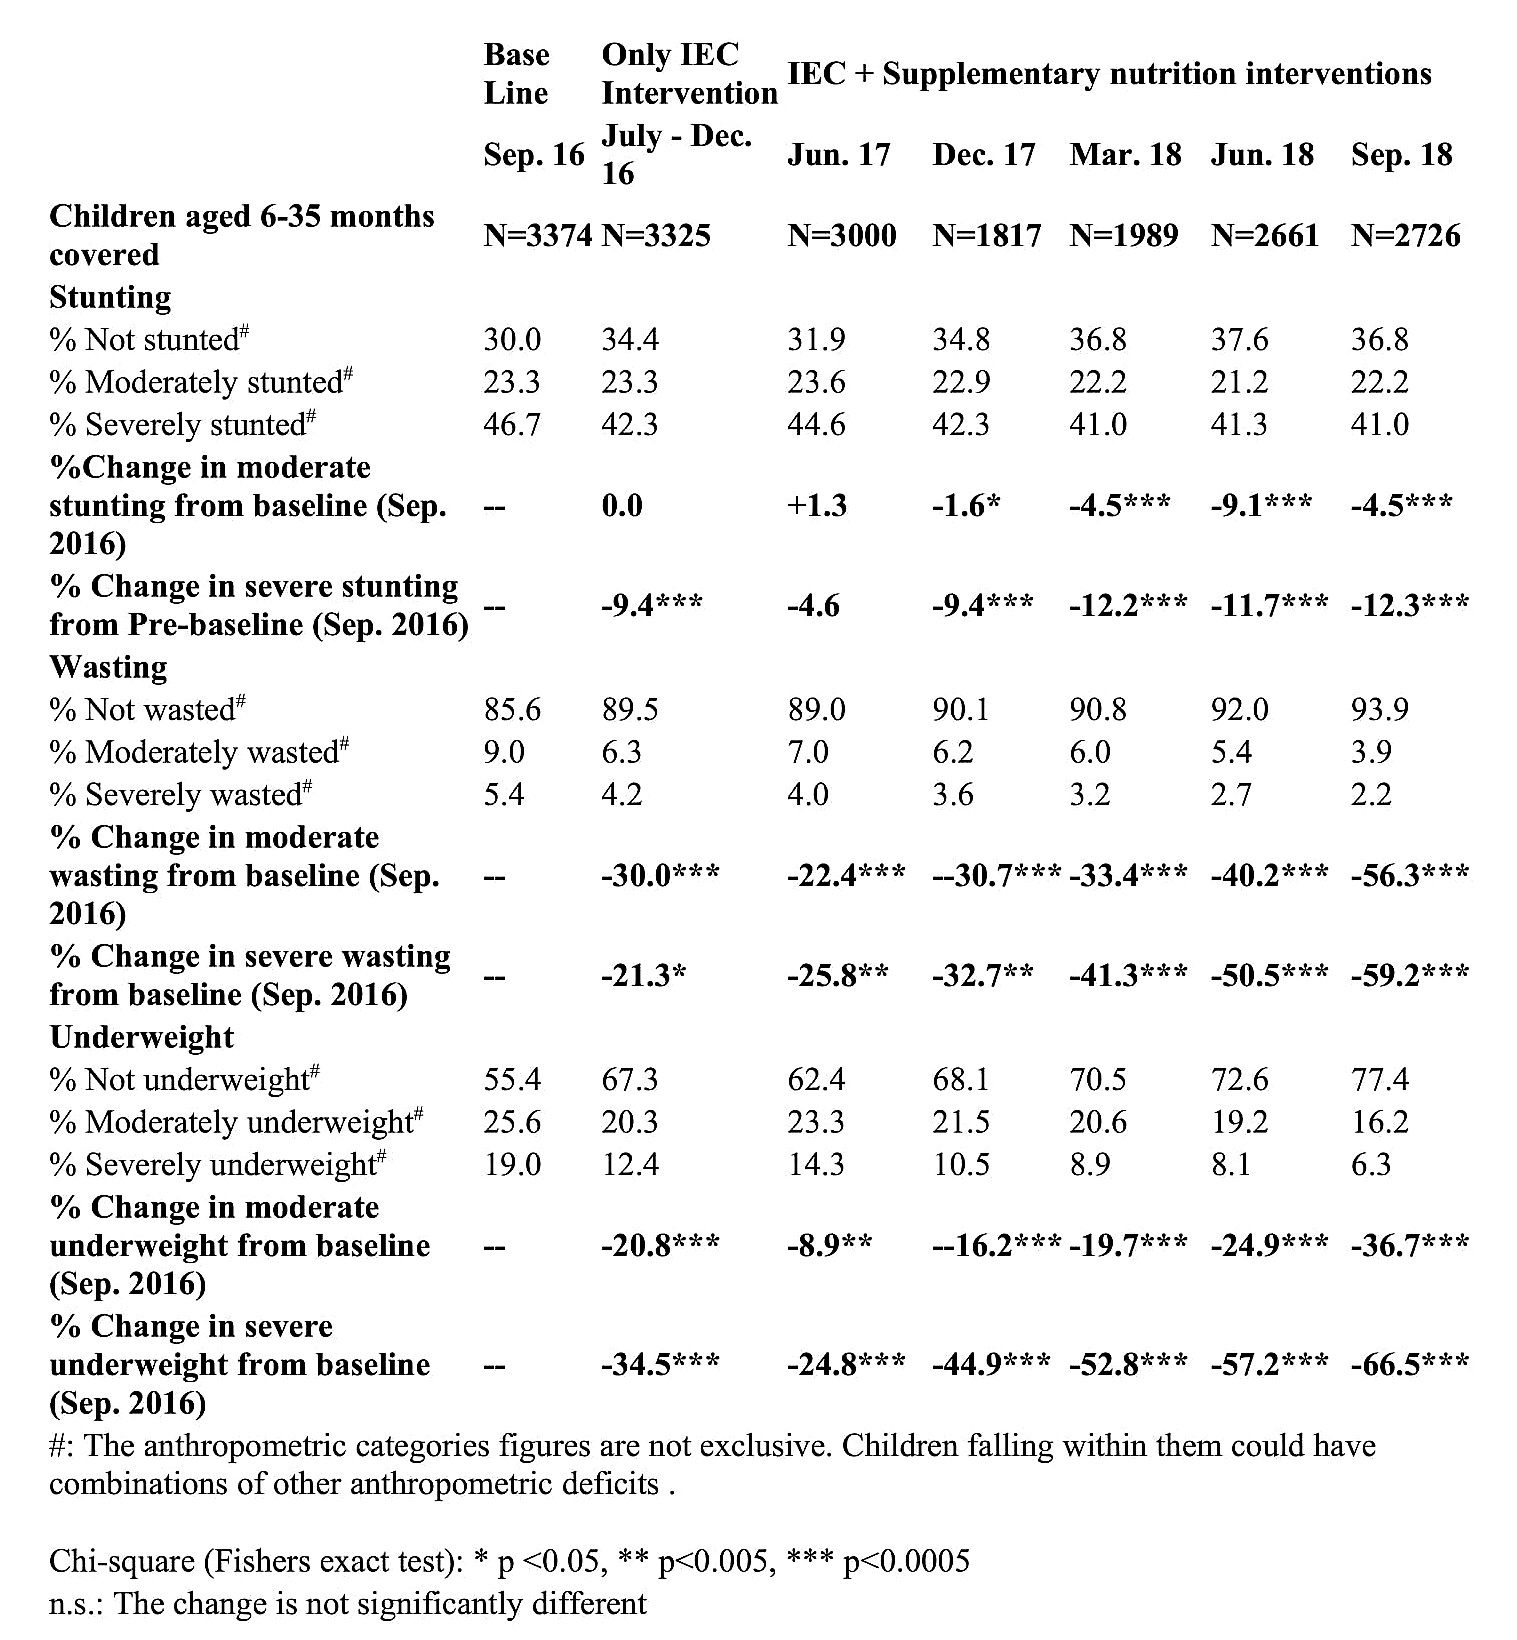
Table 1 presents percent change in severity of stunting, wasting and underweight from base line in September 2016 until September 2018 among the cross-sectional group at different points in time as indicated, and the significance of change in indicators as compared to the base line by the end of two years of intervention (September 2018). Stunting dropped from 70.0% at baseline to 63.2% at end-line and severe stunting dropped from 46.7% to 41.0%; wasting dropped from 14.4% at baseline to 6.1% at end-line and severe wasting dropped from 5.4% to 2.2%; underweight dropped from 44.6% at baseline to 22.5% at endline and severe underweight dropped from 19.0% to 6.3%. Hence, as the interventions progressed, there was a significant drop of 56% in moderate wasting levels and of 59% in severe wasting levels. Interventions had maximum and significant impact on underweight as proportion of severely underweight children dropped by 67% (from 19% to 6.3%) and moderately underweight children dropped by a significant 37% (from 26% to 16%). Due to interventions, there was significant drop in both severe wasting (59%) and moderate wasting (56%). Although significant, drop in severe stunting was 12% and moderate stunting was 5%.
Thus, Table 1 conclusively establishes that there was significant improvement in stunting, wasting and underweight even with only IEC interventions and behaviour change until December 2016. However, with IEC and nutrition supplementation which started in October 2016 in Chincholli Block and in December 2016 in Devadurga Block, the improvements in anthropometric measures became highly significant.
Table 1: Percent changes in severity of three anthropometric measures as interventions progress and significance of change in these measures as compared to baseline (pre-intervention) period, among 6-35 month old children in Cross Section Group

Results: Cohort Group
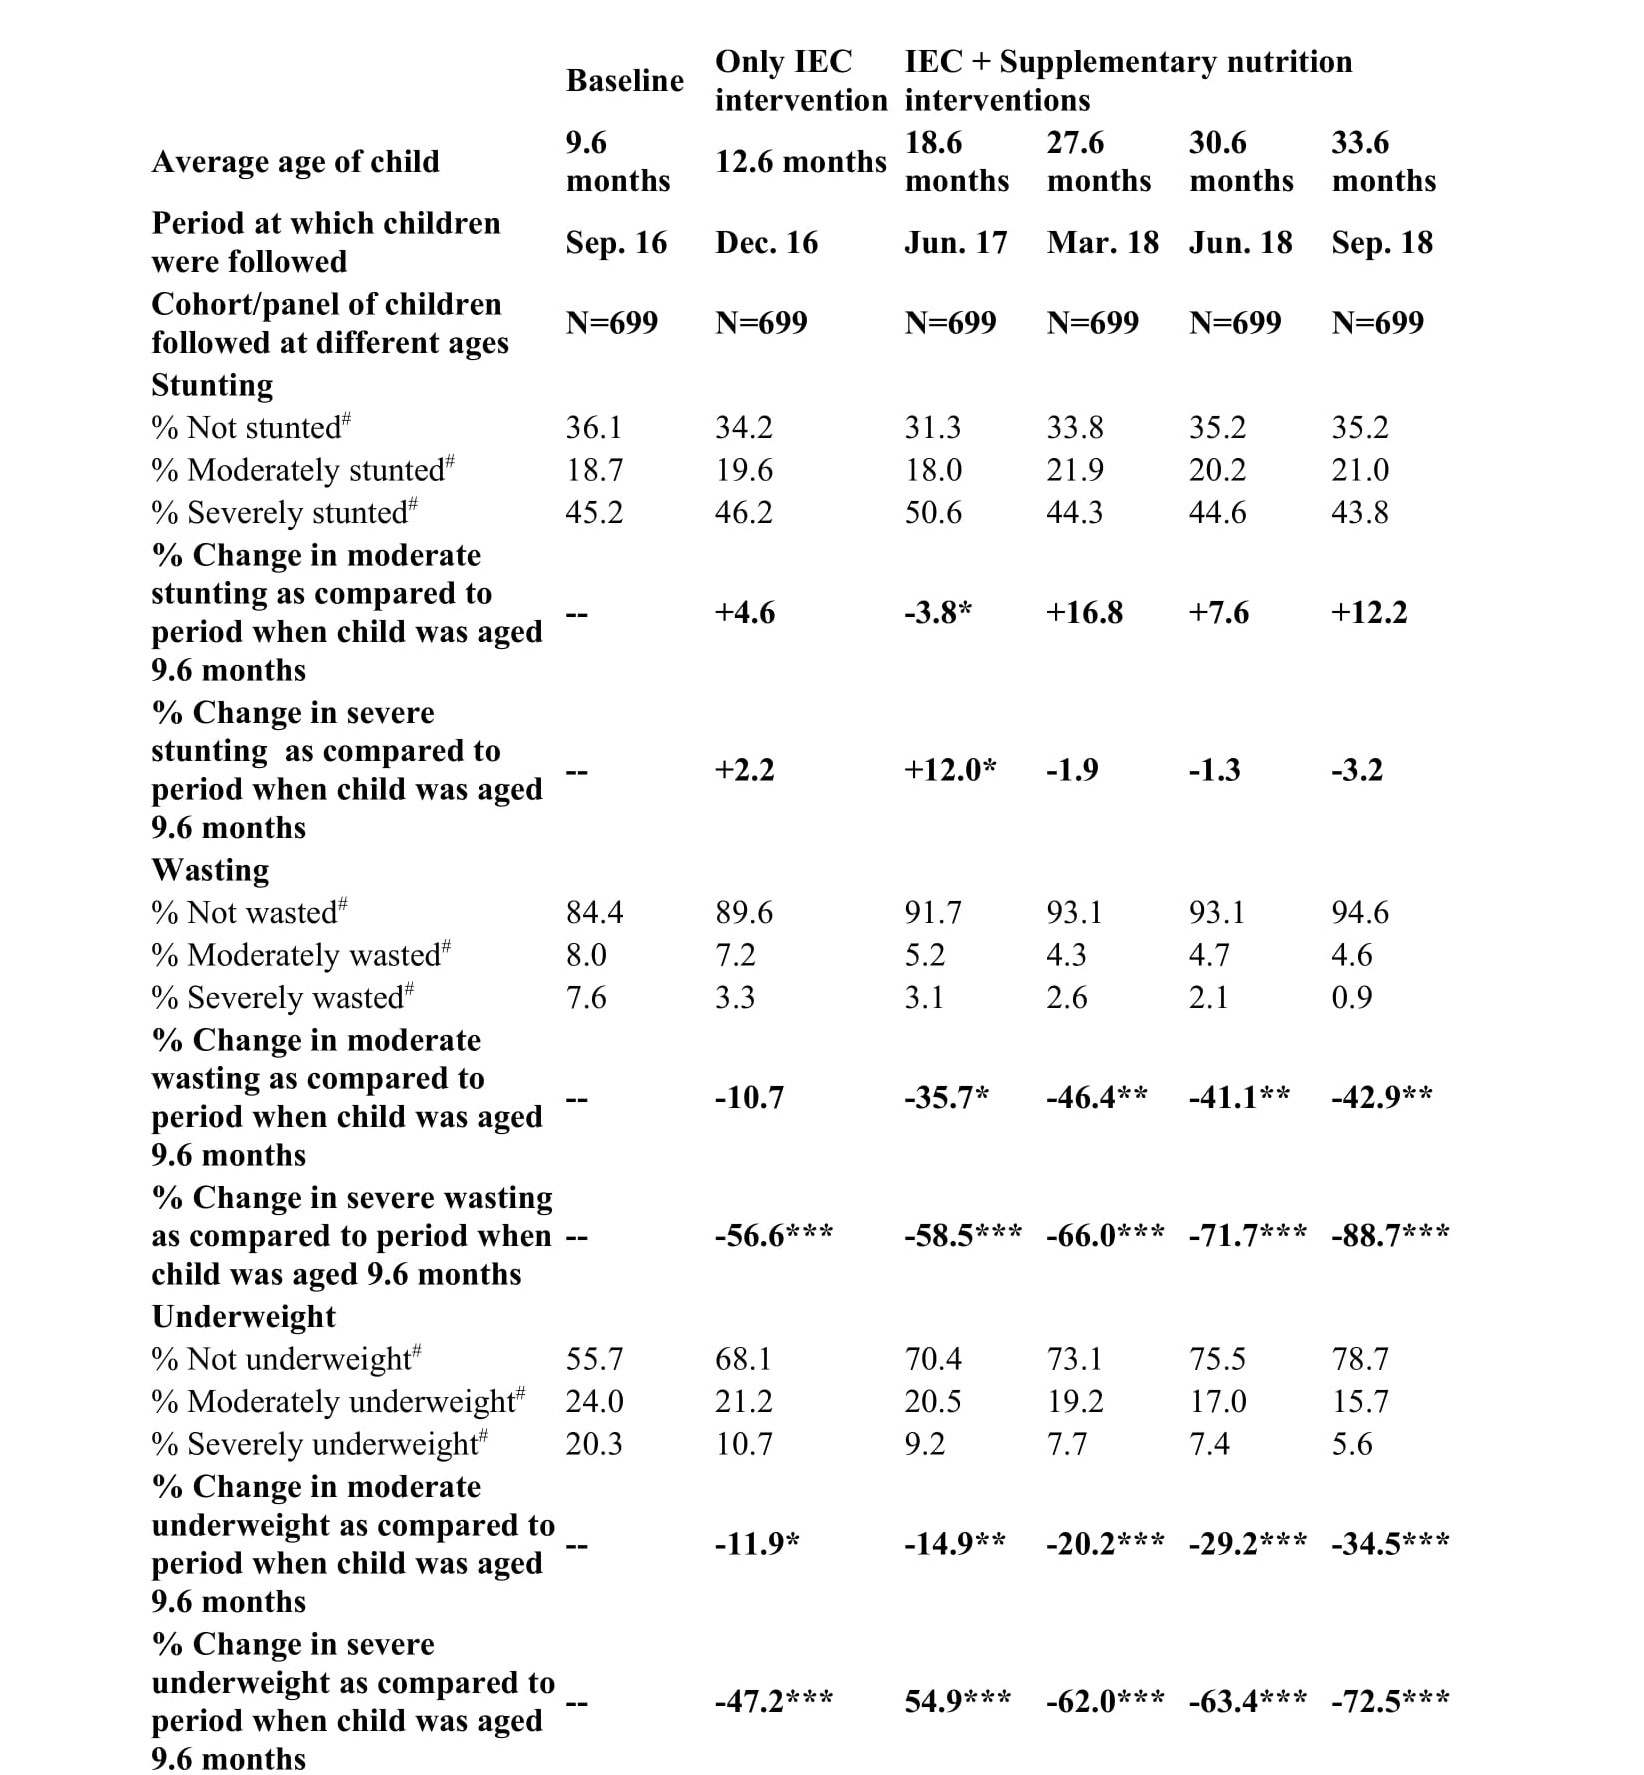
Table 2 below describes the percent change in severity of stunting, wasting and underweight among cohort of 699 children who were periodically followed from an average age of 9.6 to 33.6 months, right through the complete duration of the project intervention phases. With increase in age of child and duration of intervention, there was a corresponding substantial and significant decline in proportion of moderate as well as severely wasted and underweight children. However, during this period there was slight and insignificant increase (12%) in proportion of moderately stunted children, and negligible and insignificant drop (3%) in proportion of severely stunted children. There was also a highly significant drop (89%) in proportion of severely wasted children from 7.6% to 0.9%, and significant drop (43%) in moderately wasted children from 8.0% to 4.6%. Almost similar changes were noticed in severe and moderate underweight levels, during this period.
From Table 2, it may be concluded that as the child’s age increased from average 9.6 months to 33.6 months and as the duration of interventions progressed there was significant and corresponding decline only in wasting and underweight indicators. There was no significant change, in fact a marginal increase in the percentage of moderately stunted children, and a marginal decrease in the percentage of severely stunted children.
Another important conclusion that can explain the marginal increase of moderately stunted children is that, as some children came out of the wasted and underweight category, they transitioned into stunting, particularly moderate stunting, because though their weight for age and weight for height indicators had improved within 2 years of the project period, this time was not enough for improvement in the height for age indicator, which would enable them to move out of the stunting category. Clearly, to reverse the transition of newly stunted children who were previously underweight or wasted, the focused inter-generational and inter-sectoral interventions as in this Pilot Project need to be in operation for a much longer period. This is more clearly and numerically explained in Figures 1 to 3 below.
Table 2: Key anthropometric measures, percent change, significance of change in the measures as compared to baseline, as children’s age grew from 9.6 to 33.6 months in the Cohort group

#: The anthropometric categories are not exclusive. Children falling within them could also have combinations of other anthropometric deficits.Chi-square (Fishers exact test): * p <0.05, ** p<0.005, *** p<0.0005 n.s.: The change is not significantly different
Gender Variations
Variations in proportion of stunting, wasting and underweight in cohort of children, in both the intervention blocks, according to the gender of the children are provided in Table 3.
Both at baseline and at end of implementation phase, girls appear to have better indicators than boys for all the three anthropometric measures. The Table shows that in both the blocks and among both the genders, as the duration of intervention phase reached 24 months, there was a decrease of more than 60% in the proportion of wasted children and around 50% decrease in the proportion of underweight children. However, there was an increase in the percentage of stunted children (63.9% to 64.8%) in both blocks, but only among male children. Proportion of wasted children at 9.6 months who became stunted by 33.6 months was 22% more among boys as compared to girls (69% among boys and 47% among girls) and proportion of children who were underweight at 9.6 months who became stunted by 33.6 months was 14% more among boys as compared to girls (44% in boys and 30% in girls). The reasons for the lower impact of interventions on the nutritional indicators of male children requires further research.
Table 3: Prevalence of three anthropometric measures by gender in both blocks in September 2016 (average age of child 9.6 months) and in September 2018 (average age of child 33.6 months)
| |
% Stunting |
% Wasting |
% Underweight |
| 9.6 months |
33.6 months |
9.6 months |
33.6 months |
9.6 months |
33.6 months |
| Blocks |
|
|
|
|
|
|
| Devadurga (N=377) |
65.0 |
66.6 |
16.7 |
5.6 |
44.8 |
19.1 |
| Chincholi (N=322) |
62.7 |
62.7 |
14.3 |
5.3 |
43.8 |
23.9 |
| Gender |
|
|
|
|
|
|
| Boys (N=347) |
65.4 |
69.7 |
18.4 |
5.8 |
49.3 |
23.3 |
| Girls (N=352) |
62.5 |
59.9 |
12.8 |
5.1 |
39.5 |
19.3 |
| Total (N=699) |
63.9 |
64.8 |
15.6 |
5.4 |
44.3 |
21.3 |
Changes and Transitions within Undernutrition, Stunting and Wasting
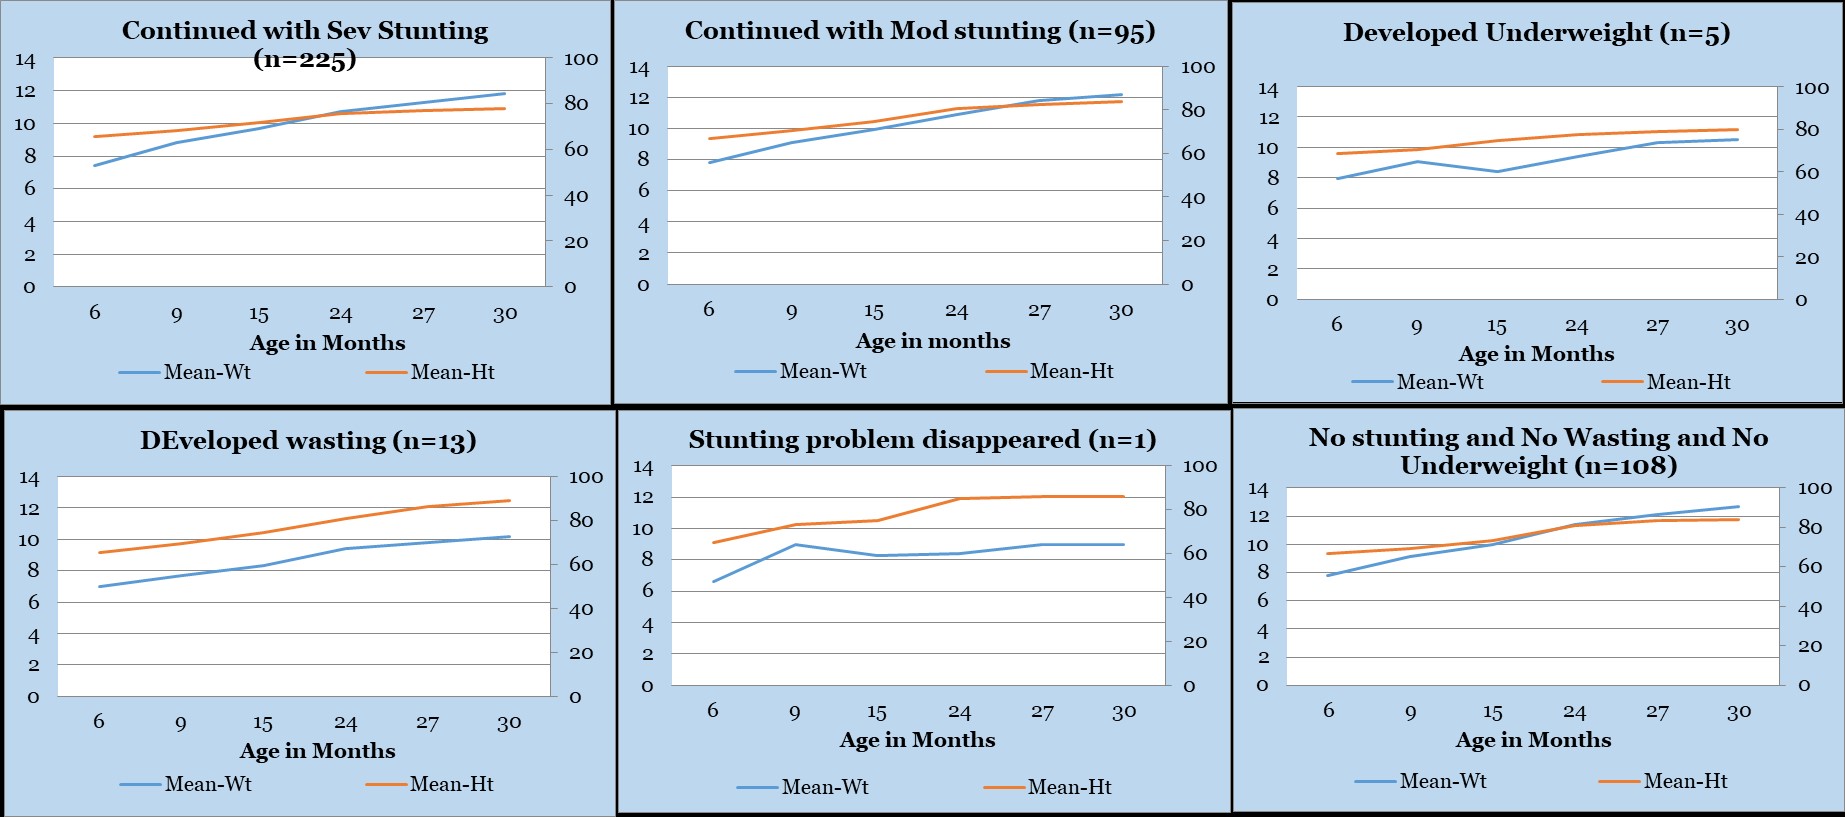
Figures 1, 2 and 3 provide valuable data and insights regarding the weight and height changes that occurred as the interventions progressed in duration among the cohort group, and how the three anthropometric measures transitioned as the children grew from an average age of 9.6 to 33.6 months and the duration of interventions completed 24 months in September 2018. In the base line, out of 699 children 477 are stunted, 109 are wasted and 310 are underweight. Out of 477 stunted children, overlap of wasting into stunting is 13% and overlap of underweight into stunting is 51.5% . Among 310 underweight children, there is an overlap of 28.7% children who are wasted.
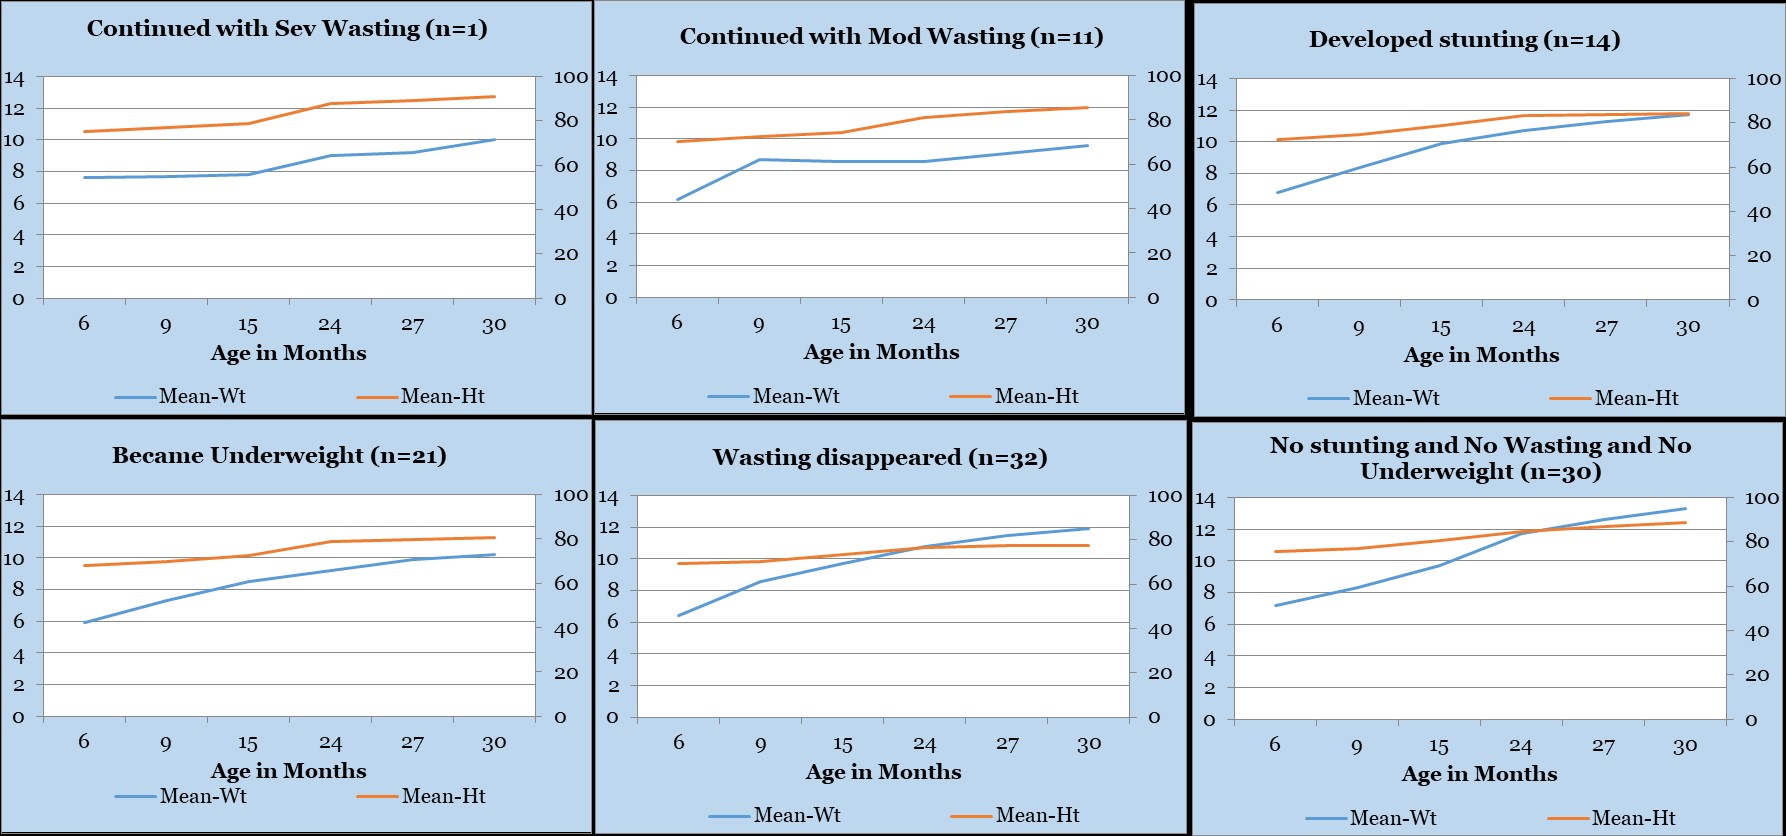
Figure 1 shows the mean height (cm) and weight (kg) of 447 stunted children and their anthropometric transition over the course of the project. The Figure indicates the critical correlation between age, height, and weight which enables a stunted child to transition from stunting to underweight and then transition to be being neither underweight, neither wasted nor stunted. The Figure also indicates the correlations between age, height, and weight where the children continued with severe or moderate stunting, or developed severe or moderate underweight, or severe or moderate wasting.
Figure 1 also presents graphic representation of the changes that occurred in weight (in kilograms) and height (in centimetres) of 447 stunted (severe or moderate) children of 9.6 months age that enabled them to transition to acquire different anthropometric combinations by the time they became 33.6 months of age after having continuously received 24 months of KMNP interventions.
Out of the 447 children who were stunted at the beginning of interventions, 108 (24%) children became normal (not stunted, not wasted and not underweight) by 33.6 months. The mean weight of these children increased by 63% (from 7.8 KG at 9.6 months to 12.7 KG by 33.6 months) and their height increased by 26% (from 66.7 to 84.2 CM) and height and weight intersected at around 18.6 months and both continued to grow at the rate required for their age.
However, half (n=225) of the stunted children continued with severe stunting at 33.6 months because their mean weight increased by 59% (from 7.4 to 11.8 KG) but their mean height increased only by 19% (from 65.5 to 78.0 CM). Their height and weight intersected at around 27.6 months and thereafter the pace of increase in height for age was slower than the pace of increase in weight for age.
95 (21%) children continued with moderate stunting by 33.6 months, as in these children weight increased by 56% (from 7.8 to 12.2 KG) and height increased by 26% (from 66.7 to 83.9 CM), and the pace of increase in both weight and height for age was slow.
Figure 1: Role of weight (in KG) and height (in CM) as children who were stunted at baseline (September 2016 aged average 9.6 months) transitioned to different nutritional indicators by end-line (September 2018 aged average 33.6 months)
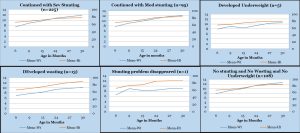
Conclusions that can be drawn from Figure 1:
Out of the 447 severely /moderately stunted children with average age of 9.6 months in September 2016:
- 225 (50%) continued to be severely stunted at average age of 33.6 months in September 2018, as the pace of these children’s weight gain was much faster than the pace of their height gain which remained inadequate;
- 95 (21%) children remained moderately stunted as the pace of increase in both weight and height gain for age was slower than required.
- 5 (1%) shorter children with poor weight gain developed severe underweight;
- 13 (3%) taller children with higher height gain and lower weight gain became severely wasted;
- 1 shorter child was no longer stunted and became underweight
- 108 (24%) children whose average height was shorter than those of other groups acquired normal status, ie., not stunted, not wasted, and not underweight, as their height and weight gain were optimal.
Thus, amongst these stunted children, the tallest children (with mean height gain of 23.7 cm in two years) and low corresponding weight gain (with mean weight gain of 3.2 KG in two years) transitioned to wasting and the shorter children with optimal weight and height gain became normal. The children who were stunted at beginning of intervention (September 2016 or aged 9.6 months) and became normal by end of intervention (September 2018 or aged 33.6 months), gained an average of 200 grams weight per month, and their height increased by an average of 0.7 centimetres per month. However, half of the stunted children in September 2016 continued with severe stunting in September 2018 as these children gained an average of 183 grams weight and 0.5 centimetres height per month, while the children with 183 grams weight gain and o.7 centimetres height gain per month continued with moderate stunting.
Figure 2 shows the mean height (cm) and weight (kg) of 109 wasted children and their anthropometric transition over the course of 24 months of the project. The figure indicates the critical correlation between age, height, and weight which enables a wasted child to transition from wasting to becoming neither underweight, neither wasted nor stunted.
Figure 2: Role of weight (in KG) and height (in CM) as children who were wasted at baseline (September 2016 or child aged average 9.6 months) towards their transition to different indicators by end-line (September 2018 or child aged average 33.6 months)
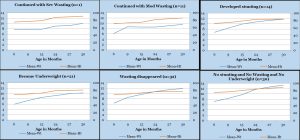
The figure also indicates a correlation between age, height, and weight where the children continued with moderate wasting, severe wasting, developed severe stunting, became severely underweight.
Of the 109 children who were wasted in September 2016 (average age 9.6 months), 30 (28%) children became normal by September 2018 (average age 33.6 months). These children had relatively better height but less than normal weight in September 2016 and from then onwards, mean weight increased by 85%, from 7.2 KG to 13.3 KG by September 2018 and their mean height increased only by 17% (from 75.5 to 88.7 CM). Their mean height and weight intersected at 27.6 months, and thereafter the pace of increase in both variables for age remained optimal.
For 32 (29%) of 109 wasted children at September 2016 (child aged 9.6 months), signs of wasting were eliminated by September 2018 (child aged 33.6 months), and they transitioned into the moderately stunted category. During the two years of intervention phase their mean weight increased by 86% (from 6.4 to 11.9 KG) and their mean height increased by 12% (from 69.2 to 77.6 CM) Their mean height and weight intersected at around 27.6 months and then pace of increase in both variables continued, but pace of increase in height for age was sub-optimal.
Of these 109 children who were wasted in September 2016, 21 (19%) children developed underweight by September 2018, as pace of growth in weight for age did not match the pace of growth in height and these two variables did not intersect till child’s age grew to 33.6 months.
14 (13%) children developed stunting by 33.6 months as pace of increase in height for age was slower, and mean weight and mean height started intersecting at around 33.6 months.
11 (10%) children continued with severe wasting at 33.6 months due to slower pace of increase in mean weight as compared with pace of increase in mean height and both variables never intersected.
Only one child continued with moderate wasting by 33.6 months of age as the pace of increase in weight was much less than pace of increase in height during 9.6-33.6 months, and both variables had no chance to intersect in this period.
Conclusions that can be drawn from Figure 2:
Out of the 109 severely /moderately wasted children with average age 9.6 months in September 2016:
- 14 (13%) children constantly gained weight and transitioned from wasting to severe stunting by the end of the project in September 2018. During baseline three of these children were wasted and severely stunted, four were wasted and moderately stunted and 7 were only wasted but not stunted.
- 32 (29%) children had rapid weight gain and moderate height gain and transitioned to moderate stunting;
- 12 (11%) relatively taller children with lowest weight gain remained severely/moderately wasted by the end of the project in September 2018;
- 21 (19%) children with very poor weight and height gain for age developed severe underweight;
- 30 (28%) children with optimal weight and height gain for age reached normal status with no stunting, no wasting and no underweight.
Thus, taller wasted children in this category, with lower weight gain remained wasted; taller children with optimal weight gain became normal; and those children who gained constant weight but did not gain enough height for age, transitioned into the stunted category.
Thus, from Figure 2 it may be concluded that those children who were wasted at the beginning of intervention and gained on an average 254 grams weight and 0.55 centimetres height per month, became normal by end of intervention in September 2018. However, 42% of the wasted children in September 2016 transitioned to moderate/severe stunting by September 2018 due to poor average weight and height gains of 229 grams weight and 0.35 centimetres height per month. Children with average weight gain of 204 grams per month and height gain of o.48 centimetres per month developed severe stunting.
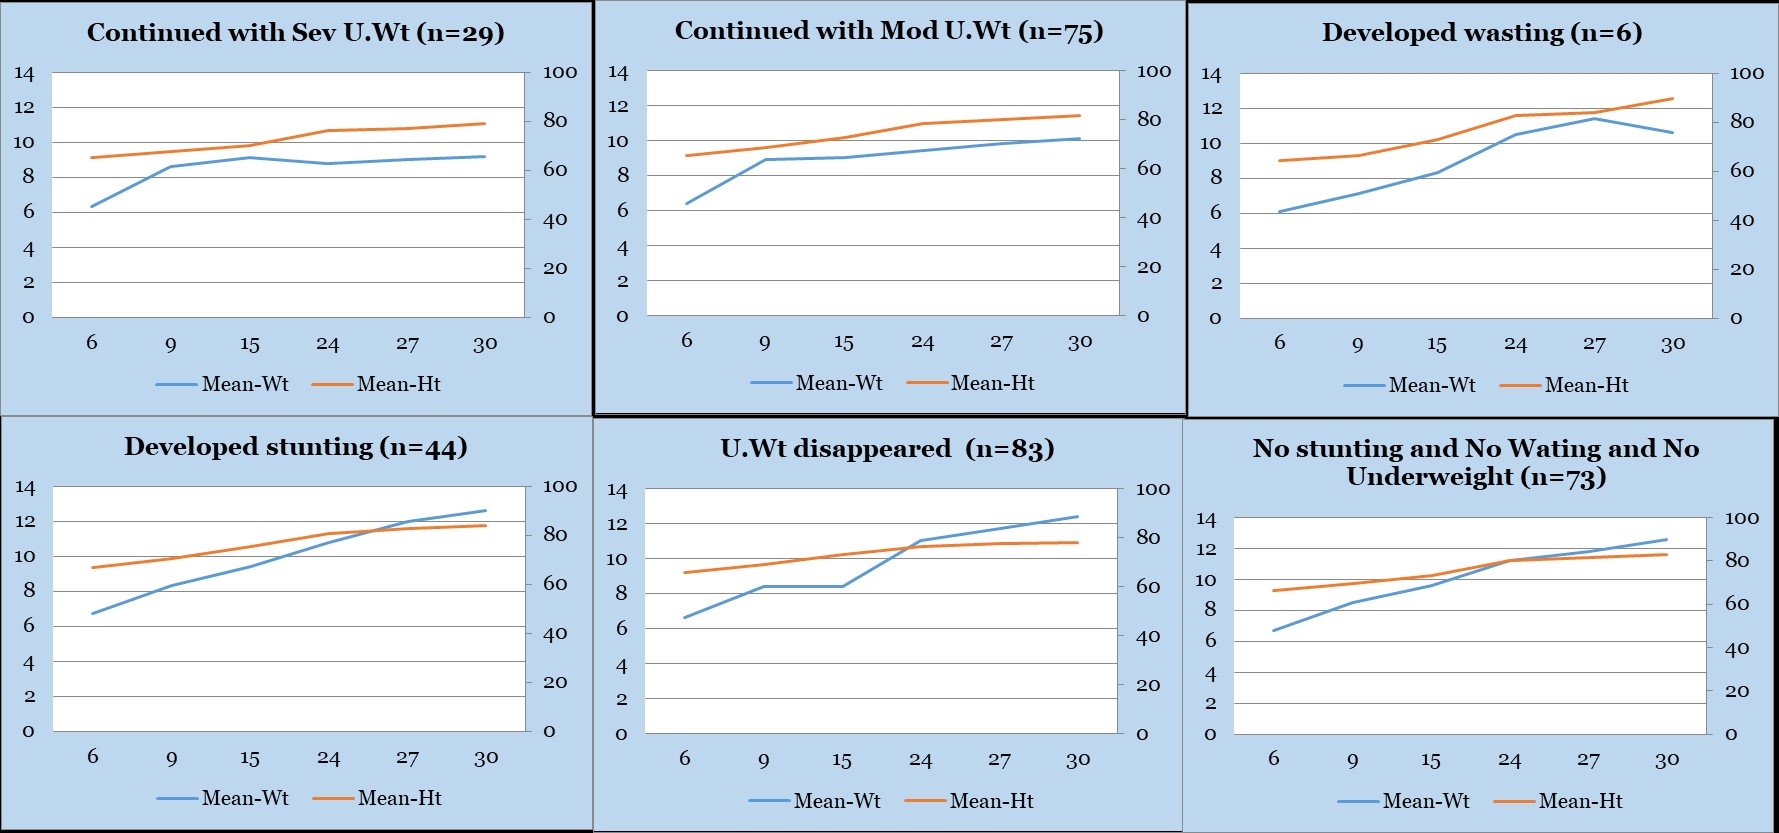
Figure 3 shows the mean height (cm) and weight (kg) of 310 underweight children and their anthropometric transition over the course of 24 months of the project. The figure indicates the critical correlation between age, height, and weight which enables an underweight child to transition from severe underweight to moderate underweight, and then transitions into being neither underweight, neither wasted nor stunted.
The figure also indicates a correlation between age, height, and weight where the children continued with severe underweight, moderate underweight, and developed severe wasting, or transitioned from underweight to severe or moderate stunting.
Figure 3: Role of weight (in KG) and height (in CM) as children who were underweight at baseline (September 2016 with average age 9.6 months) towards their transition to different nutrition indicators by end-line (September 2018 with average age 33.6 months)
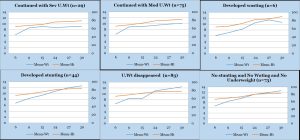
Figure 3 provides graphic representation of how weight and height by age influence the transition of 310 underweight (severely or moderately) children from September 2016 (average age 9.6 months) to reach different combinations of three anthropometric measures by September 2018 (average age 33.6 months) after 24 months of interventions.
Of them, around 25% children (n=73) became normal with no stunting, wasting or underweight, as these children’s weight increased by 88% (6.7-12.6 KG) and height increased by 25% (66.3-82.8 CM) during intervention period. For slightly more than one-fourth (n=83) children the problem of underweight disappeared but mild stunting appeared by 33.6 months, as in these children weight increased by 88% (6.6-12.4 KG) and height increased only by 18% (65.7-77.8 CM), and both these variables intersected at around 27.6 months, after which the pace of increase in height for age was sub optimal.
However, around one-fourth (n=75) children continued with moderate underweight at 33.6 months and 9% (n=29) children continued with severe underweight, as during two years of intervention their weight increased moderately by 46% (from 6.3 to 9.2 KG) although their height increased by 22% (from 65.1 to 79.1 CM), the pace of increase in weight in these two groups was slower than that of pace of increase in height and both variables did not intersect during 24 months of intervention.
Also, 44 (14%) children developed signs of severe stunting as pace of increase in height was slower than pace of increase in weight, although both variables intersected at 27.6 months age. Six (2%) children developed signs of severe wasting by 33.6 months as pace of increase in weight dropped consistently during the last three months of the project.
Conclusions that can be drawn from Figure 3:
Out of the 310 severely /moderately underweight children with average of 9.6 months in September 2016:
- 44 (14%) children constantly gained weight but pace of height gain was too slow resulting in transition from underweight to severe stunting by 33.6 months;
- 83 (27%) children with rapid weight gain but slow height gain transitioned to the moderately stunted category;
- 75 (24%) children with moderate weight gain continued with moderate underweight;
- 73 (24%) children who put on both weight and height rapidly became healthy (no stunting and no wasting and no underweight).
- 6 (1%) children with rapid weight and height gain till 30.6 months but later due to drop in weight gain transitioned to severe wasting
- 29 (9%) children with poor/stagnated weight gain continued with severe underweight.
Thus, from Figure 3 it may be concluded that 73 (24%) of children who were underweight at beginning of intervention (September 2016) became normal by end of intervention (September 2018). These children gained on an average 246 grams weight and 0.69 centimetres height per month. However, 41% of the underweight children in September 2016 transitioned to moderate/severe stunting by September 2018 due to poor height gain. Those who transitioned to moderate stunting gained an average of 242 grams weight and 0.5 centimetres height per month. Those children who gained an average weight of 246 grams and o.71 centimetres average height per month developed severe stunting. Due to poor weight gain (121-154 grams), 34% underweight children continued with moderate/severe underweight.
Thus, from Figures 1-3 we may conclude that KCNM interventions were successful in transitioning 24-28% stunted/wasted/underweight children at baseline to become not stunted, not wasted and not underweight, at end-line due to weight gain of (200-254 grams per month) and height (0.54-0.70 centimetres) gain between baseline and end-line.
Our findings (Figures 2-3) also show that 29% of 109 wasted children at baseline (child aged 9.6 months) were no longer wasted by end-line as they had transitioned to moderate stunting and another 13% wasted children at baseline transitioned into severe stunting by end-line (child aged 33.6 months). On the same lines, 27% of 310 underweight children at baseline were no longer underweight by end-line but transitioned into moderate stunting and another 14% transitioned into severe stunting by end-line.
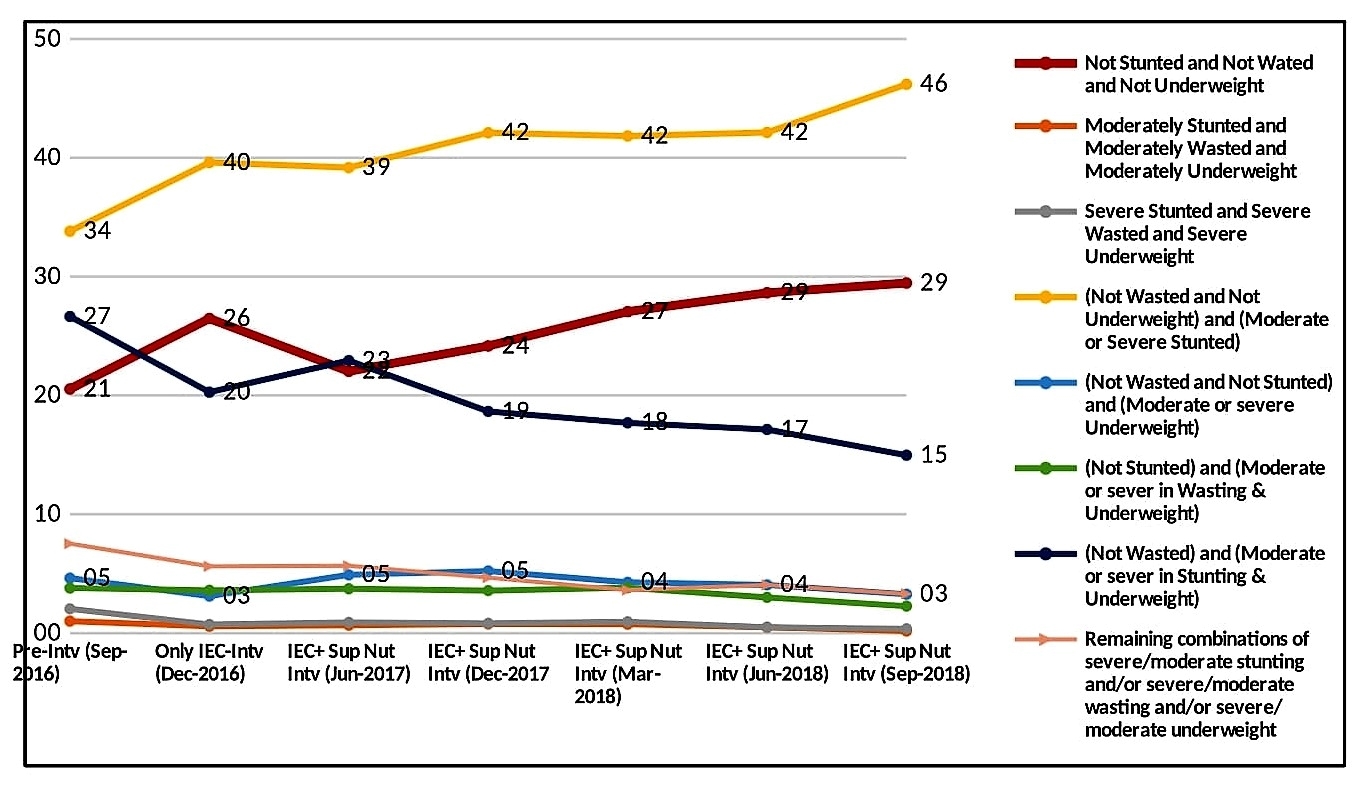
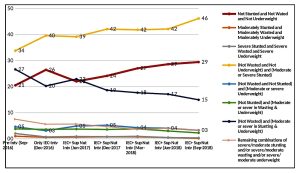
Figure 4 presents transition among the three anthropometric measures, as interventions progressed from September 2016 till September 2018, among a cross-section of 6–35-month-old children ranging from 1817 to 3374, followed-up at different points of time, who may not be the same children, but entered into the project at different points in time. The data indicates that the interventions were successful in improving nutrition levels of children, as the proportion of normal (no stunting and no wasting and no underweight) children increased from 21% at base line to 30% by September 2018 or completion of two years of intervention period, regardless of the period that the children had been under the project. A similar decline was noticed in proportion of children who were ‘’moderately/severely wasted and moderately/severely stunted and moderately/severely underweight’’ by the end of the two-year intervention period. Interventions were also successful in reducing proportion of children with different combinations of anthropometric measures. For example, children who were ’not wasted but with severe/moderate stunting and underweight’ dropped from 27-15%. Further, the percentage of children who were not wasted and not underweight and were stunted increased from 34% to 46%.
From Figure 4 it may be concluded that even among the cross-section of children with different periods of intervention, there is a 44% increase in proportion of normal children. On the lines of cohort group, even in the cross-sectional group there is an increase in proportion of only stunted children from 34% to 46% between baseline (September 2016) to end-line (September 2018), confirming the trend as seen in Figures 1,2 and 3 that many children who overcame wasting and underweight during the project period, transitioned into the stunted category.
Figure 4: Key anthropometric measures, percent change, significance of change in the measures as compared to baseline, in the Cross Section group, as interventions progressed from September 2016 to September 2018
Summary of key findings
- The percentage of ‘normal’ children, that is those who did not suffer from undernutrition, stunting and wasting increased from 21.7% at baseline to 30.5% at end line in the cohort group, and from 20.5% at baseline to 29.5% at end line in the cross-sectional group; underweight decreased from 44.3% at baseline to 21.3% at end line in the cohort group and from 44.6% at baseline to 22.6% at end line in the cross sectional group; wasting decreased from 15.6% at baseline to 5.4% at end line in the cohort group and from 14.4% at baseline to 6.1% at end line in the cross sectional group.
- By the end of intervention phase (September 2018) as compared to baseline (September 2016), there was significant drop in both moderate and severe stunting, wasting and underweight levels, in the cross-sectional group. Stunting dropped from 70.0% at baseline to 63.2% at end-line and severe stunting dropped from 46.7% to 41.0%; wasting dropped from 14.4% at baseline to 6.1% at end-line and severe wasting dropped from 5.4% to 2.2%; underweight dropped from 44.6% at baseline to 22.5% at endline and severe underweight dropped from 19.0% to 6.3%
- As compared to baseline (when average child was aged 9.6 months – September 2016) by the end-line (when average child was aged 33.6 months – September 2018) there was a significant decline in severity of only underweight and wasting indicators among the cohort group of children (severe stunting: 45.2 to 43.8, moderate stunting: 18.7 to 21.0; severe wasting: 7.6 to 0.9, moderate wasting: 8.0 to 4.6; and severe underweight: 20.3 to 5.6, moderate underweight: 24.0 to 15.7). In the cohort group, influence of interventions on improvement of anthropometric measures was highest for wasting followed by underweight, with only marginal and insignificant increase in moderate stunting. This can be explained because 29% children who were wasted and 27% children who were underweight at baseline (aged 9.6 months) transitioned into the stunting group by the time, they grew to 33.6 month (Figures 2 and 3).
- Although, influence of interventions on reduction in wasting and underweight levels were almost uniform in both the blocks and on both genders, the nutritional indicators of girls were slightly better as compared to boys, both at baseline and end-line.
- Data in Figures 1-3 indicates the following transitions from baseline (September 2016) when the children’s mean age was 9.6 months till end of the project, (September 2018) when their mean age was 33.6 months:
25% of stunted, 28% wasted and 24% of underweight children at baseline transitioned to normal (no stunting, no wasting and no underweight) at the end of the project, due to optimal gain in both weight (200-254 grams per month) and height (0.54-0.7 centimetres per month) for age.
27% of underweight and 29% of wasted children of the total cohort group at 9.6 months were no longer underweight or wasted and transitioned into moderate stunting at the end of the project.
18.2% of underweight (Figure 3) and 6.6% wasted children at baseline were no longer underweight or wasted by the end of the project and transitioned to moderate and severe stunting.
Hence, while 15.4% of the total cohort group progressed from stunting to non stunting, a new group of 19% cohort children transitioned from wasting and underweight to stunting and 2.7% children transitioned from stunting to wasting and underweight.
- From the stunted category, taller children with higher height gain and lower weight gain became severely wasted; shorter children with poor weight gain developed severe underweight.
- From the wasted category, taller wasted children with lower weight gain remained wasted, taller children with optimal weight gain became normal, and those children who gained constant weight and poor height gain transitioned into the stunted category.
- From the underweight category, children whose weight gain for age was optimal but height gain for age was not optimal, transitioned from underweight to severe stunting by 33.6 months; children with rapid weight gain but slow height gain transitioned to the moderately stunted category; children with rapid weight and height gain till 30.6 months but later due to drop in weight gain transitioned to severe wasting; children with poor/stagnated weight gain continued with severe underweight.
- It can be concluded that KCNM interventions were successful in reducing the incidence of underweight and wasting among children between baseline to endline. Interventions were also successful in increasing proportion of normal children (not wasted, not stunted, not underweight) in both the cross-sectional and cohort groups between baseline and end-line.
A Unique Project that Provides Insights about Anthropometric Transitions
Perhaps this is a first of its kind project that provides evidence of the role of changes in weight (in KG) and height (in CM) of children who are underweight / wasted / stunted at 6 months as they transition to normalcy (no stunting and no wasting and no underweight) or to other indicators by the time they reached the age of 30 months, and also how three anthropometric measures transition within themselves, either improving, remaining static, or deteriorating, with increase in age and increase in duration of intervention.
Most interesting is the effect of the interventions in revealing the dynamics of stunting. KMNPP interventions were successful in significantly reducing severe stunting by 12% and moderate stunting by 5% in the cross-sectional children aged 6-35 months (Table 2). However, in the cohort group there has been a non-significant reduction in severe stunting from 45.2% to 43.8%, and an increase in moderate stunting from 18.7% to 21%. (Table 3). A study of Figures 1, 2, and 3 clearly indicates the pattern of the stunting transition. The total number of stunted children at baseline in September 2016 was 447, (63.9% of 699 cohort group children). Out of them, 108 children (15.4% of 699 children) were no longer stunted in September 2018. However, 127 out of 310 underweight children at baseline (18% of 699 children) transitioned from the underweight category to the stunted category in September 2018 as their height for age was increasing at a slower pace than weight for age. Additionally, 46 out of 109 wasted children at baseline (6.5% of 699 children) transitioned to stunted category in September 2018 as their weight for age increased but was not matched with increase of height for age. In total, therefore, while there was a 15.4% elimination of stunting within the cohort group, there was an addition of 19% stunted children who had transitioned from the wasted and/or underweight category. If we take into account 2.7% stunted children who transitioned to the wasting and/or underweight category, this could be a plausible explanation as to why the incidence of stunting in the cohort group increased overall by around 1 percentage point as can be seen in Table 2 and Figure 1. Hence, as the interventions were of a duration of only two years, which may not be a threshold duration for higher impact on reducing stunting, the analysis related to transition of beneficiary children between the three outcome indices of stunting, wasting and underweight, may require interventions of a much longer duration and more research for a robust interpretation.
Conclusion
The positive outcomes of this project provide clear evidence that through a multisectoral and intergenerational approach, the problem of under-nutrition in children can be addressed rapidly and successfully at community/family level through the KMNPP strategy of:
- Addressing the information deficit among families and communities and bringing about behaviour change through effective and sustained grassroots IEC campaign which provides knowledge and awareness about proper nutrition practices, proper child, adolescent and maternal nutritional care, and creating demand for on-going, nutrition, health and sanitation programmes.
- Bridging the calorie-protein micronutrient deficit among target groups by making available affordable fortified, multi grain energy food supplementation for the targeted population.
- Creating actual convergence of nutrition and nutrition related services at the village and community level by involving community groups like NGOs/SHGs/panchayats, and creating demand through awareness generation.
- Real time monitoring
As this intervention has been successfully implemented in one of the most backward areas of India by supplementing and converging with existing government programs, and because the ‘’socio-ecological approach’’ of the intervention design involves family, community and governmental agencies as stakeholders to the program; and because the project actually implements several principles that have been advocated by experts over the last few decades, such as, the inter-sectoral, intergenerational interventions; emphasis on IEC and behaviour change; emphasis not only on exclusive breast feeding until six months, but also on complementary feeding, the lack and inadequacy of which is the root cause of child undernutrition in India, there is strong justification for its replication in chronic malnutrition areas. The interventions are simple but comprehensive, they address programmatic gaps, they provide for a dedicated village level volunteer, and a certain sequence of essential interventions with real time monitoring that can be replicated in any pocket of chronic undernutrition.
This study also concludes that the three anthropometric deficits of wasting, stunting and underweight, all born out of common causes of deprivation impact each other, transition within themselves, and can coexist simultaneously in different combinations. Hence, policy and programmes for addressing or preventing them, by both governments and development agencies, should not view these indicators separately in isolation, but in a much more integrated and holistic manner through the common lens of child undernutrition.
References
Directorate of Census Operations, Karnataka (2011), District Census Handbook, Gulbarga, Census of India
Directorate of Census Operations, Karnataka (2011), District Census Handbook, Raichur, Census of India
Human Development Division Planning, Programme Monitoring and Statistics Department, Human Development Performance of Districts, Taluks and Urban Local bodies in Karnataka 2014- A Snapshot, Government of Karnataka- http://14.139.60.153/handle/123456789/12283
ICMR- Indian Council of Medical Research, NIN- National Institute of Nutrition (2019): Impact Evaluation of Karnataka Multi-Sectoral Nutrition Pilot Project
International Institute for Population Sciences (2017): National Health Family Survey (NFHS 4), Karnataka state report 2015-16. Mumbai
International Institute for Population Sciences (2017): National Health Family Survey (NFHS 5), Karnataka state report 2019-20. Mumbai
Ministry of Health and Family Welfare, Government of India, UNICEF and Population Council, 2019: Comprehensive National Nutrition Survey (CNNS) National Report, New Delhi
Office of Registrar General (2020): Special Bulletin on Maternal Mortality in India 2016-18, Sample of Registration System, New Delhi
Suresh Kunhi Mohammed, Abeyah Alomair, India: Piloting a more intense approach to malnutrition in Karnataka (2020), World Bank https://blogs.worldbank.org/endpovertyinsouthasia/india-piloting-more-intense-approach-malnutrition-karnataka
Website of Karnataka Comprehensive Nutrition Mission www.karnutmission.org.in
____________________________________________________________
Acknowledgements
- Government of Karnataka – Mr S V Ranganath and Mr T M Vijay Bhaskar, former Chief Secretaries, Government of Karnataka; Ms Vandita Sharma, Additional Chief Secretary & Development Commissioner; Dr Ramana Reddy, Former Additional Chief Secretary Health and Family Welfare; Mr Subhash Chandra and Dr Nagambika Devi, former Additional Chief Secretaries, Department of Rural Development and Panchayati Raj; Dr Shalini Rajneesh, Additional Chief Secretary, Planning, Programme Monitoring and Statistics Department; Mr Selva Kumar, former Mission Director, National Rural Health Mission and Mr D V Swamy, former Mission Director, National Rural Livelihoods Mission, Karnataka.
- World Bank and JSDF – Ms Julie Mc’laughlin, Dr Patrick Mullen, Ms Abeyah A Al- Omair, Dr Suresh Kunhi Mohammed, Ms Mohini Kak
- Global Alliance for Improved Nutrition – Dr R Sankar, Mr Tarun Vij, Dr Sadhana Bhagwat, Dr Arijit Chakarvarthy
- Karnataka Health Promotion Trust (KHPT), implementation partner- Mr Mohan H L, Mr Ramachandra Rao, Ms Agnita RN, Mr Shivayogi Matapathi, Mr Manjunath Doddawad
- Ms Harshita Chinnaswamy, Research Assistant
Endnotes
[1] Ms Veena S Rao was Advisor to Karnataka Comprehensive Nutrition Mission and conceptualized and led the pilot projects. Presently, she is Director, AuroCentre for Public Nutrition, Public Health and Public Policy
[2] Dr. Shalini Rajneesh is presently Additional Chief Secretary, Department of Planning, Programme Monitoring and Statistics, Government of Karnataka
[3] Dr. Chaya is the lead in Karnataka Evaluation Authority, Department of Planning, Programme Monitoring and Statistics, Government of Karnataka
[4] Mr. Hanimi Reddy is a statistician with International Centre for Research on Women(ICRQ)
[5] Mr S Bharadwaj is a statistician with Sigma Research and Consulting Pvt Ltd.
[6]http://karnutmission.org.in/AboutUs/strategy/KARNATAKA%20COMPREHENSIVE%20NUTRITION%20MISSION.pdf
[7]Human Development Performance of Districts, Taluks and Urban Local bodies in Karnataka 2014- A Snapshot http://14.139.60.153/handle/123456789/12283
[8] http://karnutmission.org.in/documents/KMSNPP_Report_26DEC18.pdf
[9] Village level worker of the national Integrated Child Development Program
[10] Accredited Social Health Activist – Village level health worker under the National Health Mission
[11] Data from project and Taluk Panchayats (Block elected bodies)
[12] http://karnutmission.org.in/documents/KMSNPP_Report_26DEC18.pdf
[13] All the preparatory activities were completed in September 2016, namely, selection of beneficiaries in both the Blocks, selection and training of VNVs in both the Blocks, distribution of Nutrition Cards to all beneficiaries, and the commencement of data entry and real time monitoring