IN A NUTSHELL Author's NoteAs part of a series, a new article here aimed at identifying countries with life expectancy (as a proxy for health and well-being) above the global average, while maintaining feasible economic (below world average GDP per capita) and ecological (below recyclable thresholds) standards. The latest analysis includes criteria such as life expectancy disaggregated by sex, healthy life expectancy, GDP and GNI per capita in CV and PPP units, wealth per capita, carbon and ecological footprint per capita, and biocapacity per capita

By Juan Garay
Professor of Global Health Equity Ethics and Metrics in Spain (ENS), Mexico (UNAChiapas), and Cuba (ELAM, UCLV, and UNAH)
Co-founder of the Sustainable Health Equity movement
Identifying International Sustainable Health Models
How to Achieve 10% Higher Life Expectancy with 50% Less Resources (and 12% of Resources for Health)
Guess Which Models Should Lead
For the past 15 years[i], we have been studying international benchmarks for “best feasible health” levels to measure the WHO’s constitutional goal—achieving the best feasible health for all people[ii], the only globally shared health objective among nations. Our aim is to quantify the global burden of health inequity.
We identify countries with life expectancy (as a proxy for health and well-being) above the global average, while maintaining feasible economic (below world average GDP per capita) and ecological (below recyclable thresholds) standards. The selection criteria are reviewed every five years in consultation with experts from health, economics, and ecology. The latest analysis includes 12 criteria, such as life expectancy disaggregated by sex, healthy life expectancy, GDP and GNI per capita in CV and PPP units, wealth per capita, carbon and ecological footprint per capita, and biocapacity per capita[iii].
After identifying countries that meet these “best feasible health” standards, we calculate adjusted mortality rates by country, age, and sex group, and compare them to actual deaths. The excess deaths beyond what is expected at feasible levels constitute the global burden of health inequity. The proportion of these excess deaths is referred to as the relative burden of health inequity. This analysis is conducted every five years when the UN Population Division releases demographic data. This year, we are publishing ahead of the usual schedule due to the UN’s release of projections for 2021-2025 and beyond, which also allow us to update estimates of the carbon footprint ethical threshold[iv].
Our findings are shared via interactive data dashboards, maps, and country reports in the Global Atlas of Health Equity[v]. Currently, we are reviewing all steps of the updated analysis with the latest UN data through participatory discussions at the monthly open webinars of the Sustainable Health Equity Movement[vi].
We have also referred to the 2023 ecological thresholds—1.42 hectares per capita for biocapacity and ecological footprint[vii], and 1.34 metric tons of CO2 emissions per capita[viii]. Exceeding these levels means the planet cannot recycle human resource consumption, progressively undermining future generations’ livelihoods. The impact of global warming, driven by excess carbon emissions, has been extensively studied, leading to international agreements and commitments, though these have been largely inadequate and poorly implemented. The graphs below illustrate the remaining carbon budgets for limiting global warming to 1.5°C and 2°C above the Holocene average, and the relationship with cumulative carbon emissions from 1990 to 2020, including the effects of the COVID-19 pandemic.
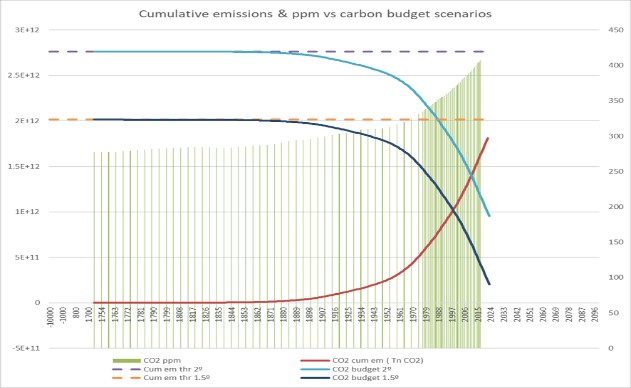
Figure 1 Cumulative CO2 emissions vs carbon budget
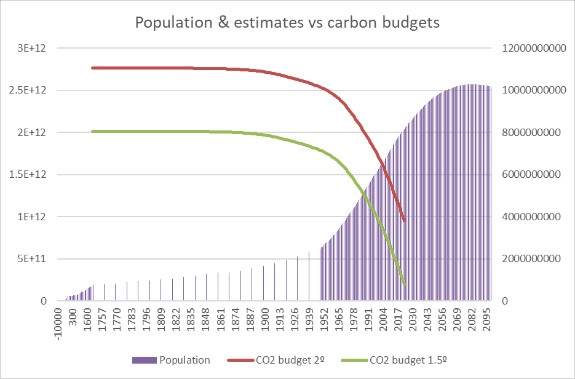
Figure 2 Carbon budget vs. human population estimates till 2100
As shown in the following graph, unless there is a radical shift across all nations and populations to reduce carbon emissions below the “ethical” threshold mentioned earlier (a goal our analysis aims to promote), the planet will reach a critical “fever” point, potentially long-lasting due to feedback effects on other planetary boundaries. This is expected to occur by 2030 with a 1.5°C increase, and by 2050 with a 2°C increase.
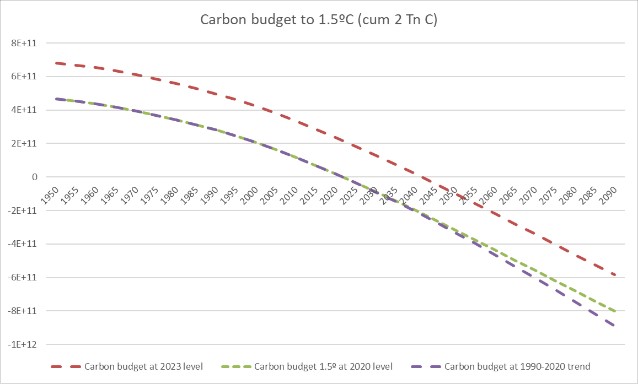
Figure 3 Carbon budget sunset scenarios
At the current trend, the excess mortality in the 21st century due to rising temperatures from excess carbon emissions is projected to exceed 220 million deaths[ix], primarily affecting low-polluting countries. This figure represents only one aspect of the broader, unsustainable impact humans are having on the planet. Graphs 1 and 2 illustrate how the global average carbon and ecological footprint has already surpassed sustainable thresholds and continues to rise.
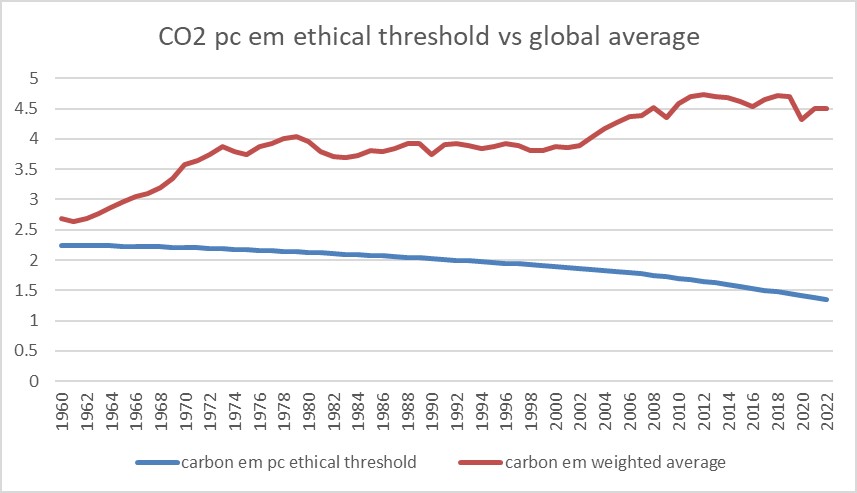
Figure 4 CO2 emissions ‘ethical threshold vs world average emissions per capita
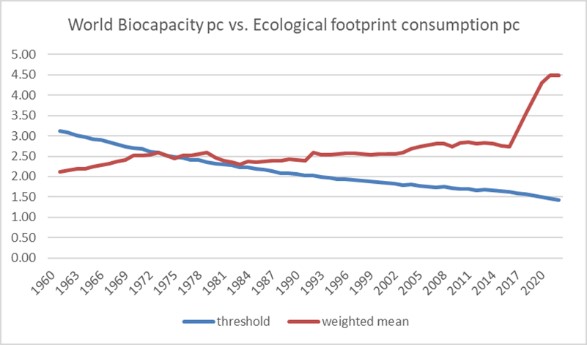
Figure 5 World biocapacity and ecological footprint threshold vs world average
As the graphs below show, the number of countries which meet the mentioned ecological sustainability criteria has gradually decreased, with only 20 countries having met all criteria since 1970, namely Afghanistan, Burundi, Benin, Burkina Faso, Comoros, Haiti, Kenya, Cambodia, Sri Lanka, Malawi, Niger, Nepal, Pakistan, Philippines and Rwanda.
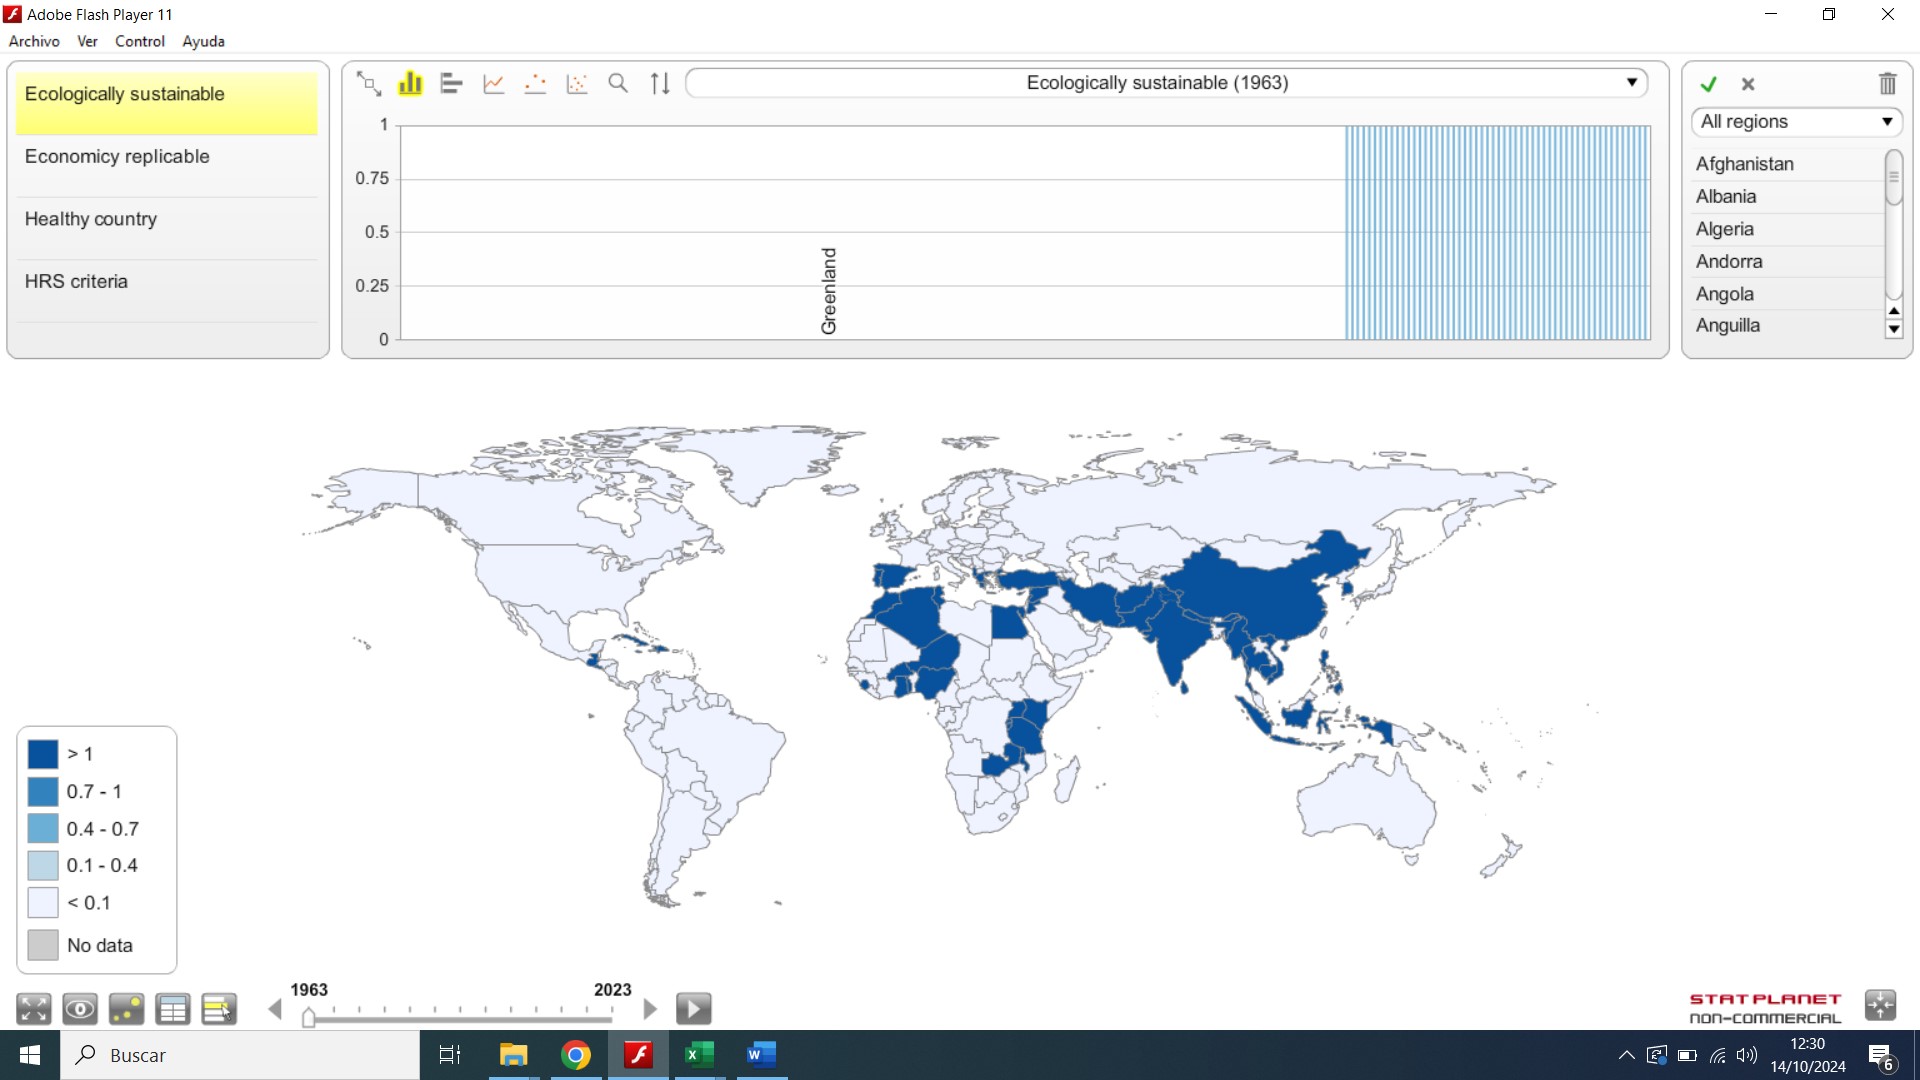
Figure 6 Ecologically sustainable countries 1970
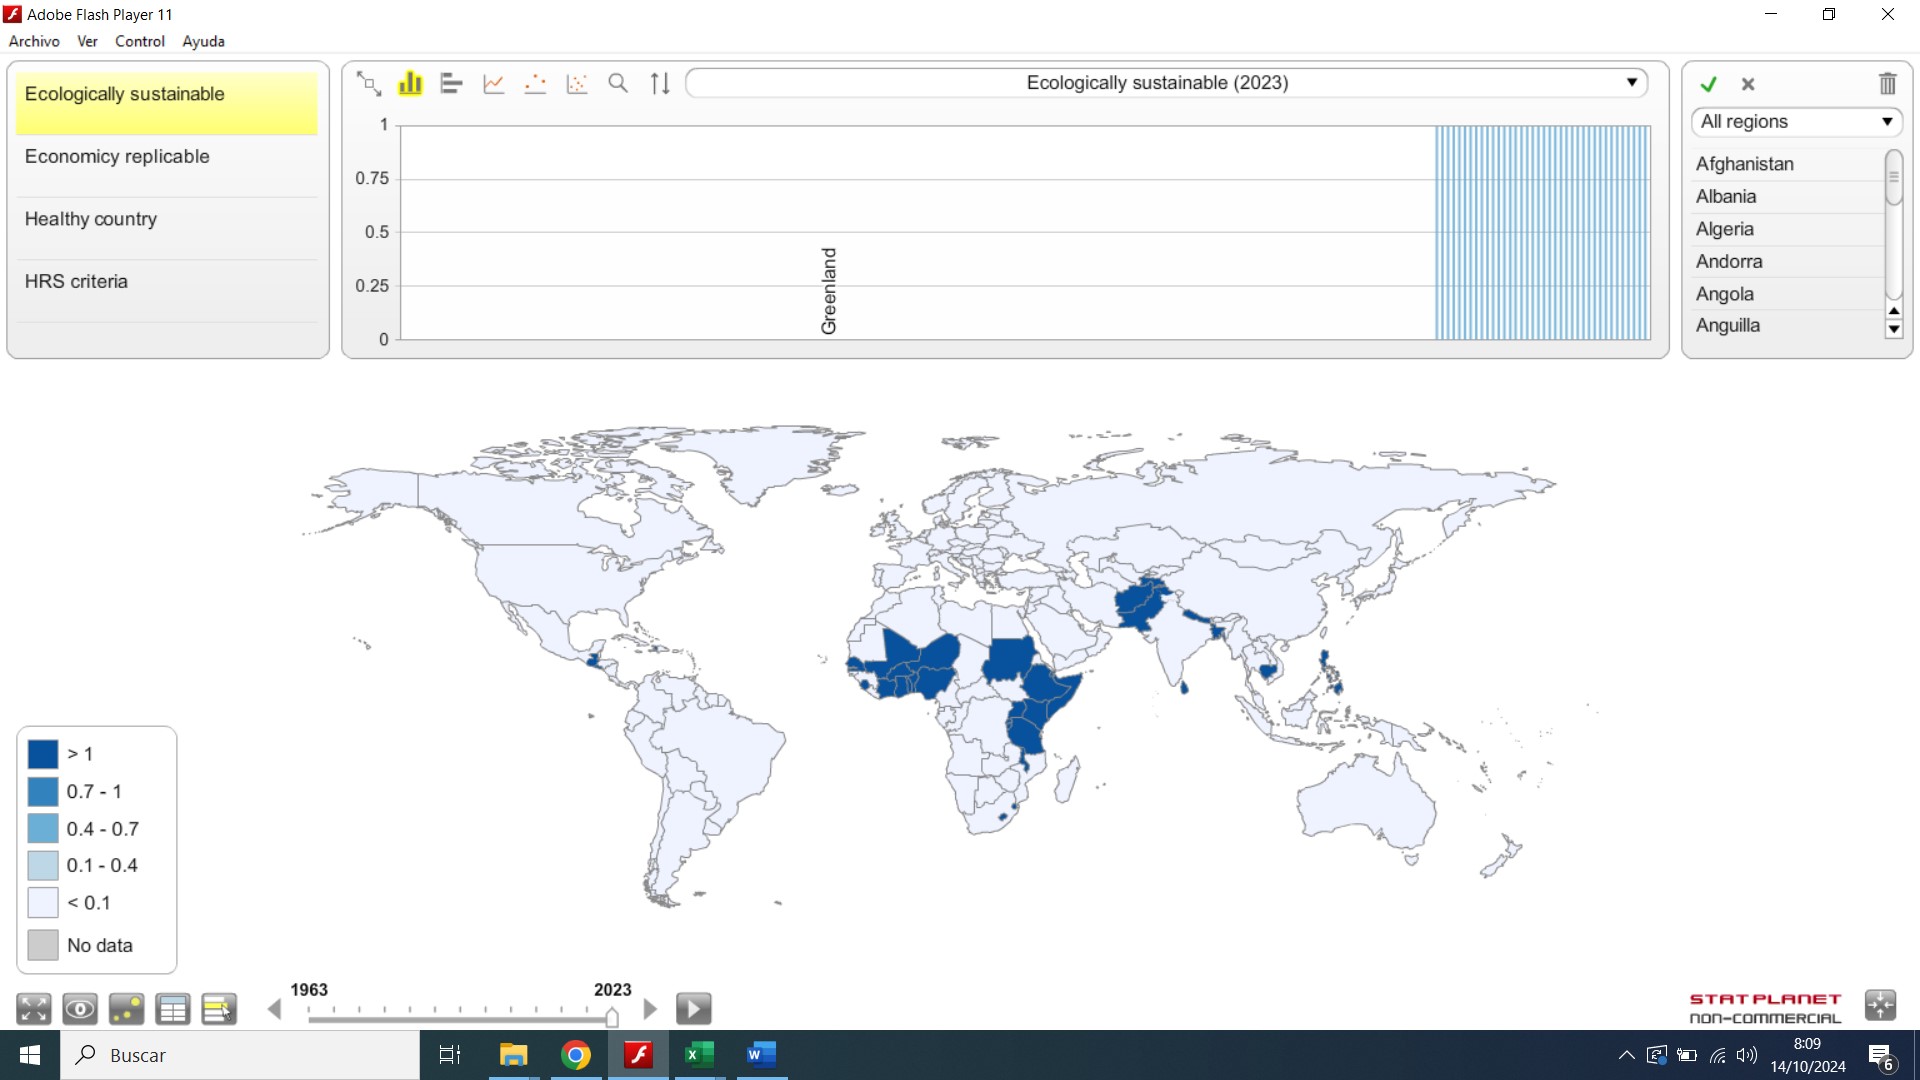
Figure 7 Ecologically sustainable countries 2023
As for the economic criteria, so it happens that all countries with ecologically sustainable rates have economic indicators below the world average. In fact, all of them have wealth pc below 34% and GDP pc in constant value below 44% of the world average. The following maps using the open source statplanet software[x], show the economically replicable countries in 1970 (with enough comparable data on GDP pc PPP) and in 2023.
Figure 8 Economically replicable countries 1970
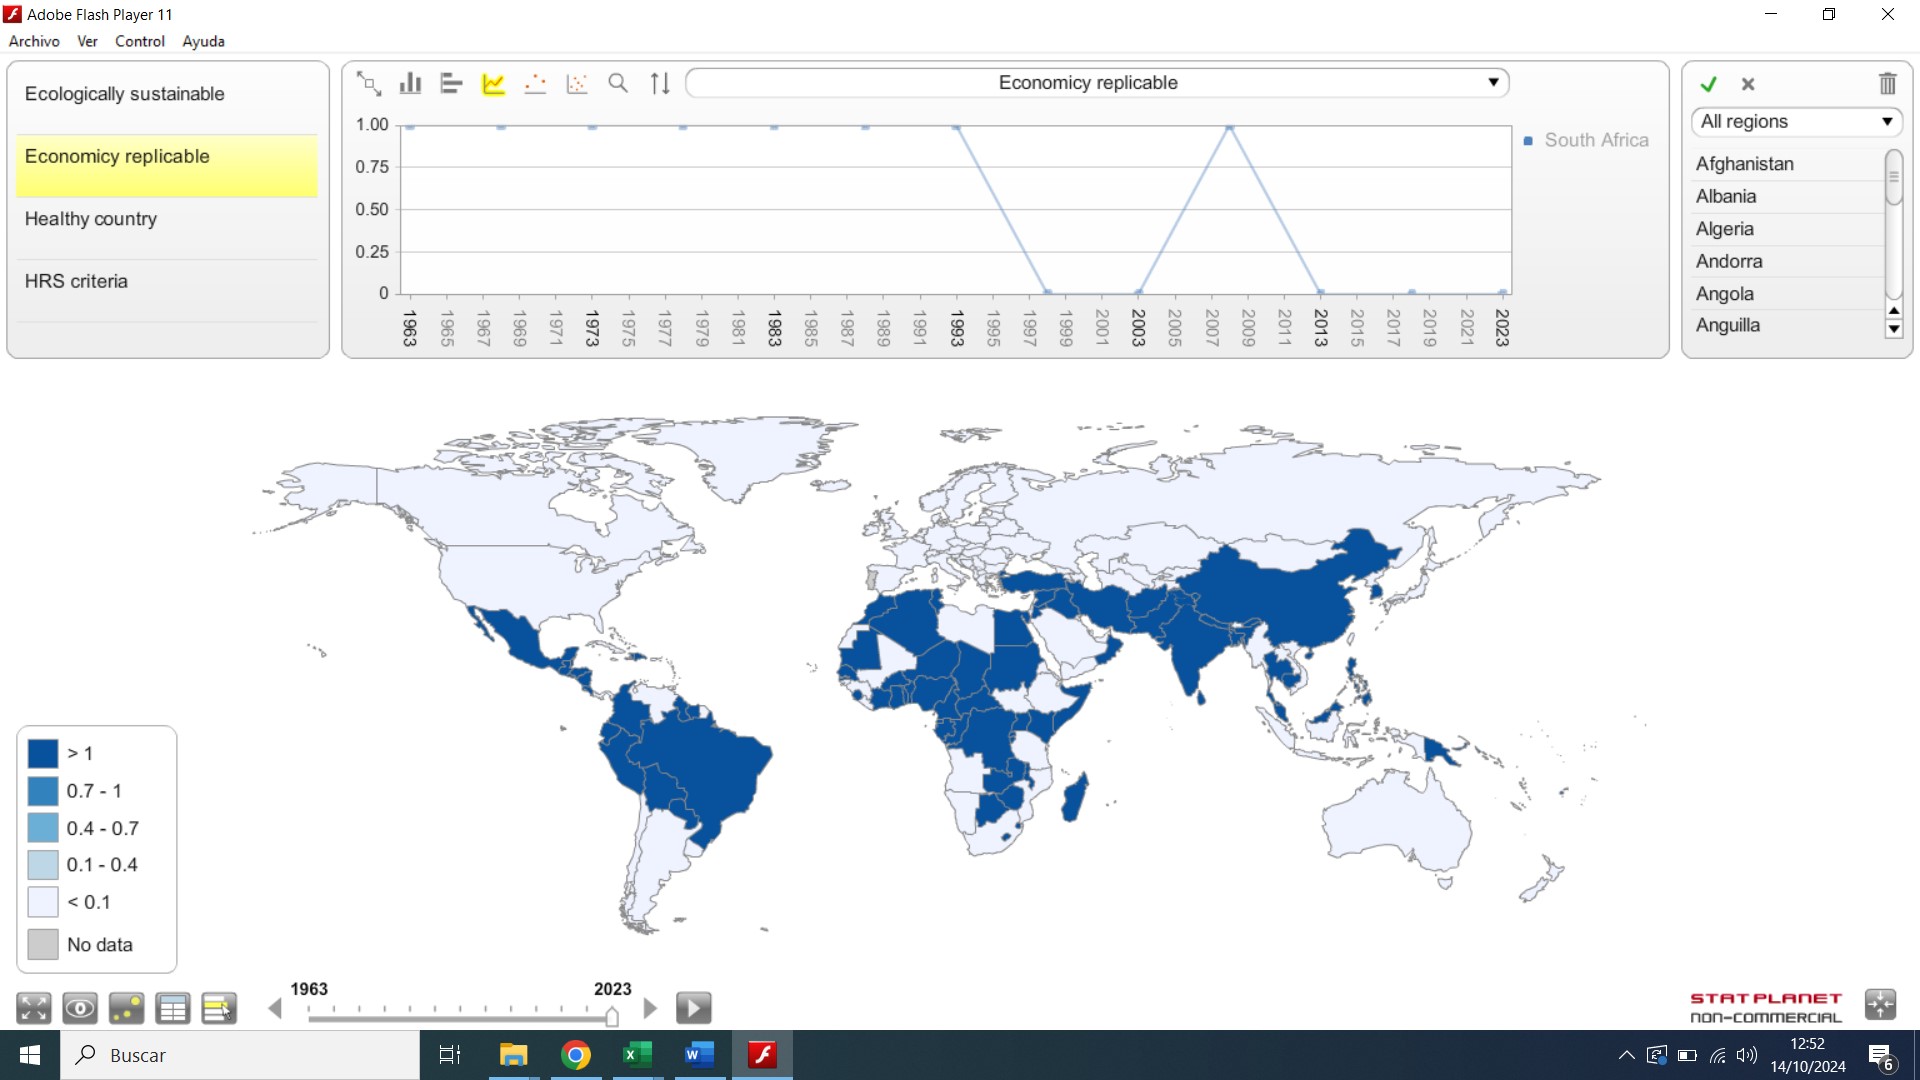
Figure 9 Economically replicable countries 2023
The final selection adds the criteria of health (average life expectancy and disaggregated by sex, and healthy life expectancy). The following maps show the countries in 1990 (when after we have data on healthy life expectancy) and 2023.
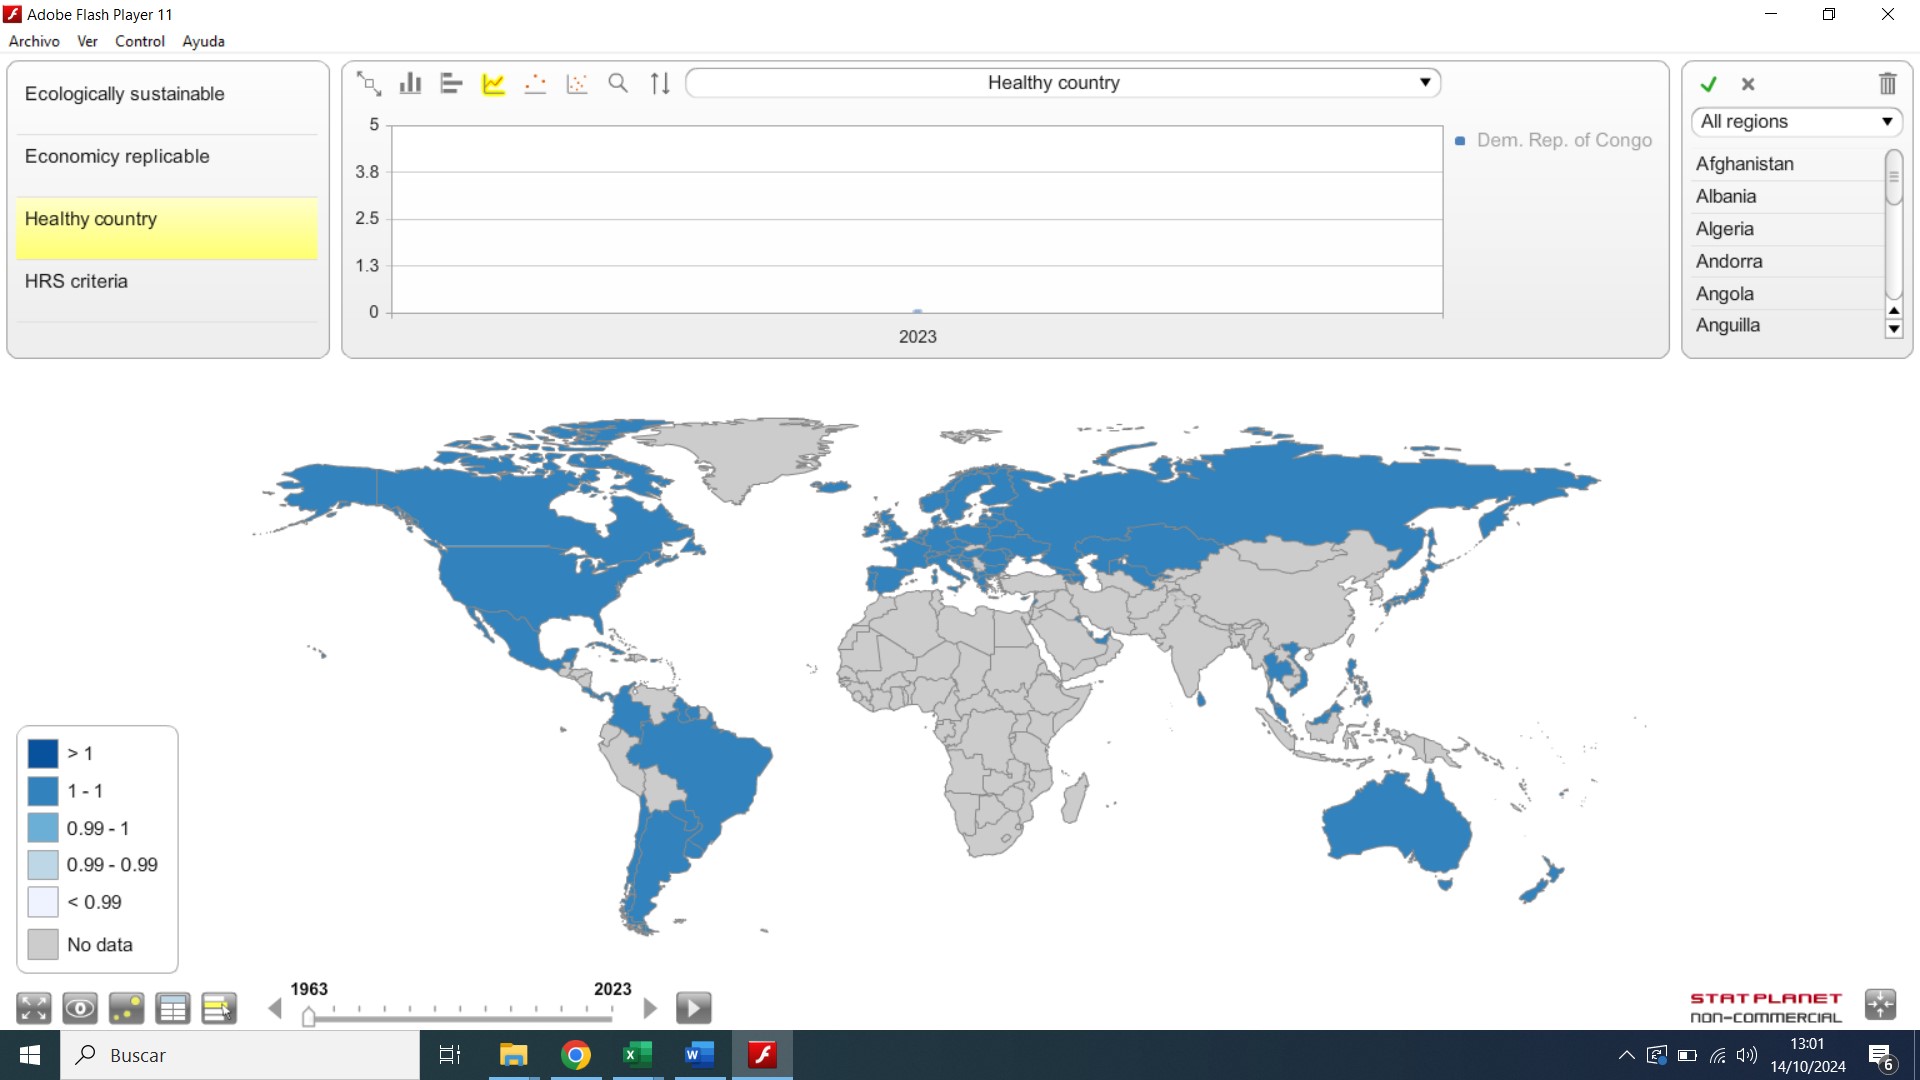
Figure 10 Healthy (life expectancy > world average) countries 1990
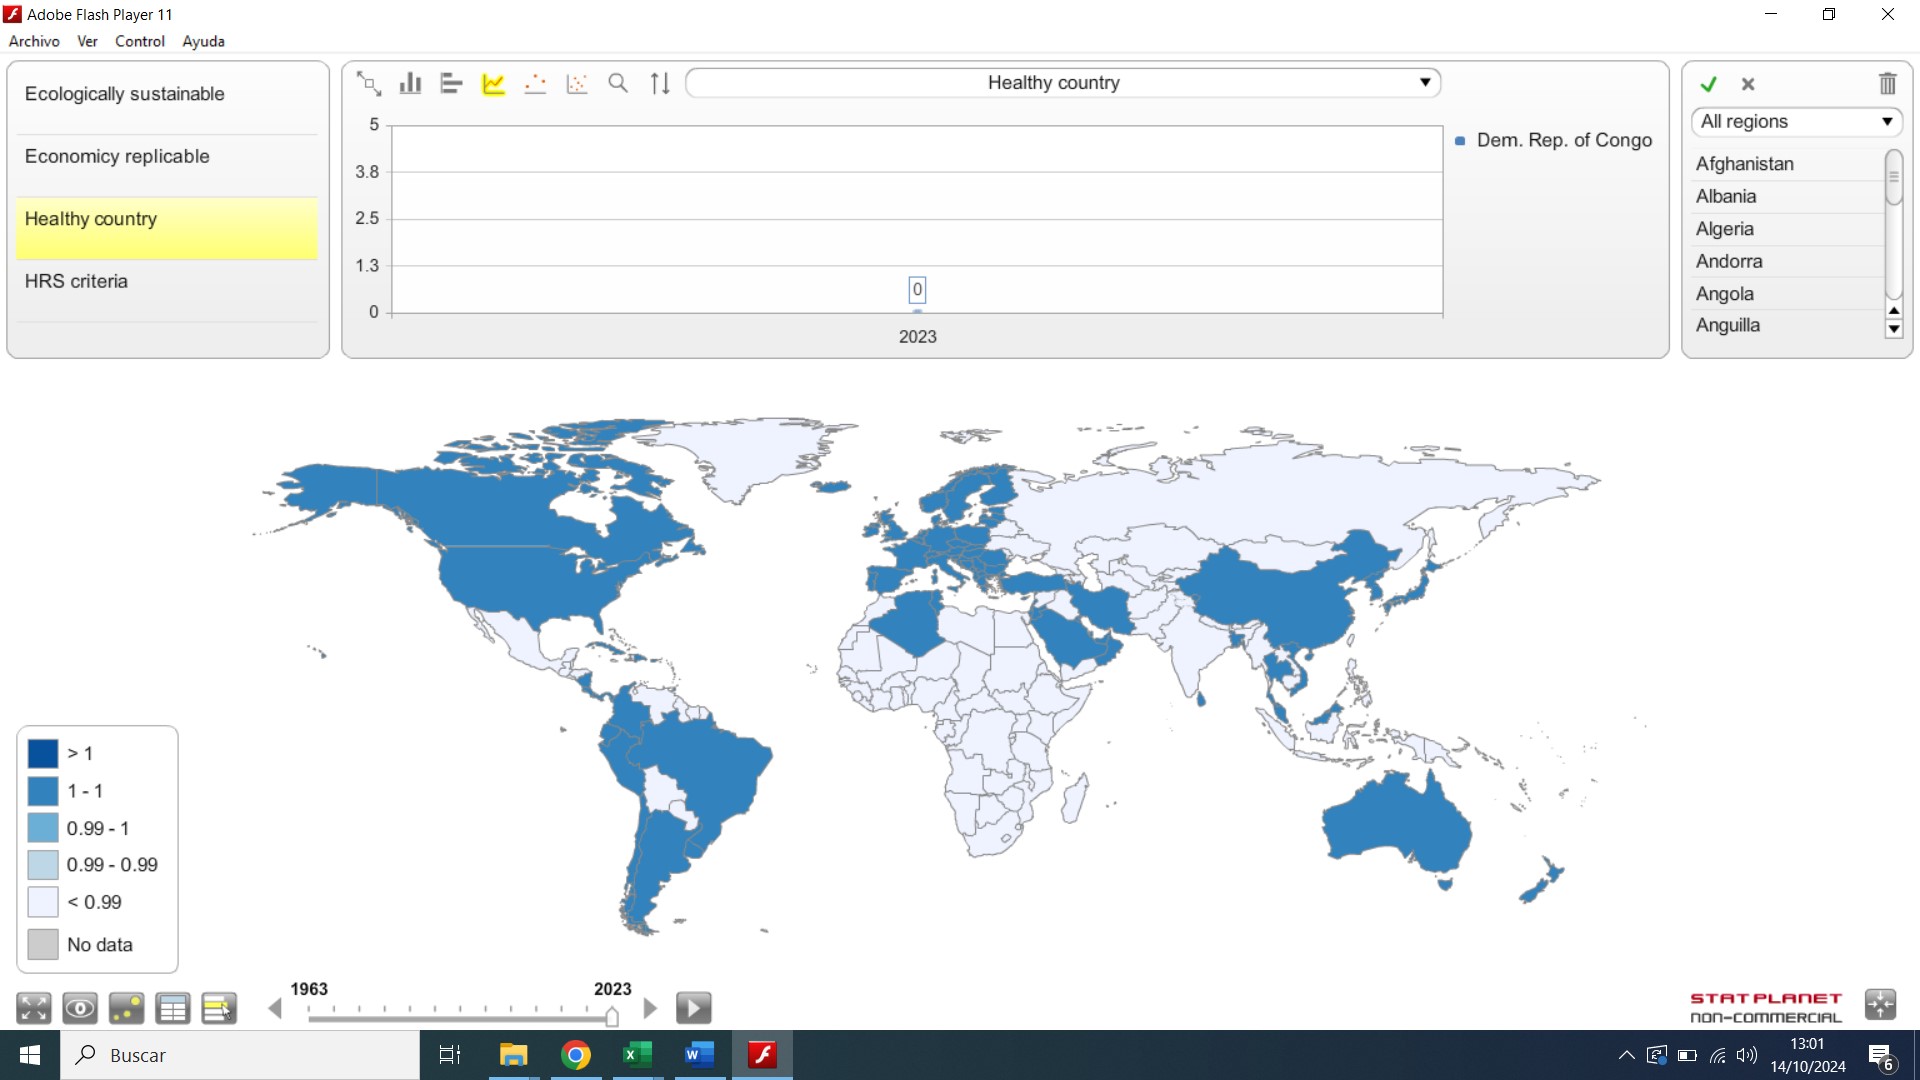
Figure 11 Healthy countries 2023
The combination of all criteria has resulted in only one country consistently meeting them from 1961 to 2023: Sri Lanka. Despite maintaining a balance with nature and using less than half the world’s average economic resources, Sri Lanka’s life expectancy is 9.8% higher than the global average—8.5% higher for men and 10.5% for women.
Global averages can be inaccurate due to reliance on time-series estimates and misleading because they obscure subnational differences. As the sample size increases and the units of analysis decrease, sensitivity improves in identifying more efficient and healthier benchmarks. We have begun analyzing subnational entities in large countries and found sustainable, healthy examples in India (Kerala, Nagaland), China (Shanxi, Guangxi, Anhui, Sichuan, Henan), Russia (Ingushetia, Chechnya, Kabardino, Dagestan, Karachay in the North Caucasus), Indonesia (Sulawesi, Kalimantan, Bali, Java), Pakistan (FATA), and Brazil (Piaui, Alagoas, Paraiba, Ceara, Para, Rio Grande do Norte). Conversely, we found none in the United States or Nigeria (neither met sustainability or health criteria), while Bangladesh has emerged, alongside Sri Lanka, as a model of sustainable health over the last three years.
Sri Lanka’s health achievements, despite a long civil war, are attributed to its universal healthcare system, established in the 1930s, which is tax-funded and free at the point of access. Despite minimal GDP spending on health, the country has made significant progress in maternal and child survival. Sri Lanka’s health expenditure per capita is only 12% of the global average and just 1.3% of the U.S.’s[xi]. Further comparative analysis could offer valuable insights for sustainable health models globally.
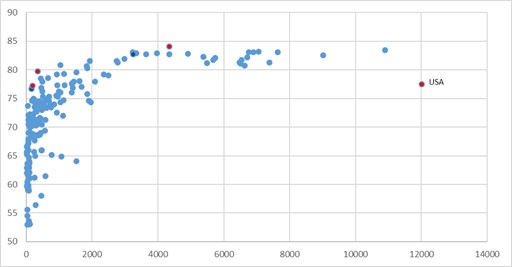
Figure 12 Health spending per capita vs. life expectancy at birth
In upcoming articles and interactive webinars, we will estimate the burden of health inequity over the past three years, examining trends and future prospects in a world still plagued by deep inequalities, environmental disregard, and growing health risks stemming from these root causes.
As noted earlier, analyzing the best feasible health and the gaps in equity requires more granular studies, ideally at the subnational level—focusing on districts of around 100,000 people, each with a referral hospital. A detailed analysis of the world’s approximately 80,000 districts will likely uncover the most efficient and sustainable models of well-being, helping to channel human efforts towards sustainable health and fostering collaboration on global public goods, in a new paradigm of human wellbeing in sustainable equity (WISE)[xii].
References
[i] https://www.binasss.sa.cr/eng.pdf
[ii] https://www.who.int/about/governance/constitution
[iii] https://doi.org/10.1093/acrefore/9780190632366.013.62
[iv] https://population.un.org/wpp/
[v] https://www.interacademies.org/news/launching-global-health-equity-atlas
[vi] https://www.sustainablehealthequity.org/concept-and-metrics
[vii] https://www.footprintnetwork.org/
[viii] https://www.peah.it/2024/07/13556/
[ix] https://www.peah.it/2018/07/5498/
[x] https://www.statsilk.com/software/statplanet
[xi] https://apps.who.int/nha/database
[xii] https://www.peah.it/2023/12/12800/
By the same Author on PEAH

Homo Interitans: Countries that Escape, So Far, the Human Bio-Suicidal Trend

Human Ethical Threshold of CO2 Emissions and Projected Life Lost by Excess Emissions

 Restoring Broken Human Deal

   Towards a WISE – Wellbeing in Sustainable Equity – New Paradigm for Humanity

  A Renewed International Cooperation/Partnership Framework in the XXIst Century

 COVID-19 IN THE CONTEXT OF GLOBAL HEALTH EQUITY

 Global Health Inequity 1960-2020 Health and Climate Change: a Third World War with No Guns

 Understanding, Measuring and Acting on Health Equity