IN A NUTSHELL Editor's NoteAs part of a series, an update here on the State of the Burden of Global Health Inequity in 2023. Alongside the recent revision of international demographic data by the United Nations, this update enhances the sensitivity of estimates by increasing the sample size of population and mortality data by country, time period, sex, and age by 25-fold. Among a number of significant results, the study continues to highlight Sri Lanka as the sole constant Health Reference Standard (HRS) from 1961 to 2023. It also reveals several critical insights as regards the distribution of the burden of health inequity: India bears the highest net burden of health inequity (nBHiE), with over 3 million excess deaths annually. Nigeria experiences the highest number of life years lost due to global health inequity (over 110 million annually). Chad has the highest relative burden of health inequity (rBHiE), with over 90% of all deaths attributed to inequity. Sub-Saharan Africa, particularly its tropical belt, remains the region most severely impacted by health inequity

By Juan Garay
Professor of global health equity in Spain (ENS), Mexico (UNACH) and Cuba (ELAM, UCLV and UNAH), principal researcher of FioCruz Institute, Brazil
Geography of Global Injustice
State of the Burden of Global Health Inequity in 2023
Since 2010, significant progress has been made in understanding sustainable health equity (SHE) [i], culminating in the development of the Global Atlas of Health Inequity[ii]. In this update, we integrate the latest demographic data from the UN Population Division[iii]. The new dataset expands the granularity significantly, transitioning from 5-year age groups to single-year cohorts and from 5-year intervals to annual data, increasing the volume of information by a factor of 25.
Given the worrying trend of intra and intergenerational levels of inequity/injustice[iv] and the need for a change of concepts of wellbeing in sustainable equity (WISE) applied to the sociopolitical and economic models, and our individual and collective ethics and lifestyles[v], we have updated before the 5-year former frequency period, the atlas of global health inequity/injustice.
- Selection of SHE References
As with previous iterations of the atlas, the selection of countries was based on meeting criteria for health, ecological sustainability, and economic replicability. These criteria define “Healthy, Replicable, and Sustainable” (HRS) countries[vi].
While the forthcoming interactive atlas update will enable visualization of temporal variations in national average per capita data, this analysis focuses on the most recent estimates for 2023. In a recent article[vii] and webinar, we detailed the methodology for identifying countries that satisfy the main HRS criteria using world bank[viii] (life expectancy, GDP and GHI pc, CV and PPP, carbon emissions pc), global footprint[ix] (biocapacity and ecological footprint pc) and WHO (healthy life expectancy)[x] data.
The biocapacity of countries with biocapacity per capita below the global average[xi] underscore the arbitrary and inequitable nature of national borders, which, despite their artificiality, are upheld by international law. Countries with biocapacity per capita above the global average enjoy disproportionate natural resource access and cannot be considered ecologically replicable, as such a privilege cannot extend globally. This includes most of the Americas (excluding Mexico and the Caribbean), Europe (except the UK and Italy), Russia, parts of West Africa, Madagascar, and the region spanning Libya to Zambia. These areas do not serve as replicable references for equitable and sustainable well-being.
Recent studies estimate that the threshold of CO2 emissions consistent with limiting global warming to a 2°C rise above preindustrial levels—the “point of no return”—is determined by the remaining carbon budget[xii] divided by the projected global population through the end of the century. The ethical threshold for CO2 emissions is currently approximately 1.34 metric tons per person per year, while limiting warming to below 1.5°C requires emissions as low as 0.3 metric tons per person per year[xiii]. Presently, countries adhering to this ethical threshold are primarily in sub-Saharan Africa, Central America, and South Asia. This distribution closely mirrors the geographical pattern of countries with ecological footprints per capita below the global average biocapacity per capita.
Human Well-being and Health (2023):
In terms of human well-being, countries with life expectancy above the global average include most of the Americas (except Bolivia and Haiti), Europe, Northwest Africa, the Middle East, the Silk Road region from Turkey to China, parts of Southeast Asia, Japan, Australia, and New Zealand. Disaggregating life expectancy by sex reveals slight differences: for males, Kazakhstan is excluded, while for females, Russia is included.
The countries meeting the HRS criteria consistently from 1961 to 2023 are those that simultaneously exhibit:
- Health criteria: Life expectancy and healthy life expectancy above the global average.
- Economic replicability criteria: GDP, GNI per capita (both in CV and PPP terms), and wealth per capita below the global average.
- Ecological replicability/sustainability criteria: Biocapacity per capita below the global average, ecological footprint below the global average biocapacity per capita, and carbon emissions below the ethical threshold.
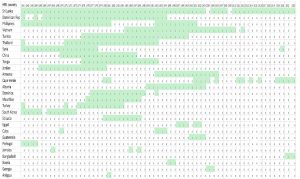
These countries are summarized in the following table:
Table 1 List of countries that met all HRS criteria during the 1961-2023 period
Sri Lanka emerged as the country that most consistently met Healthy, Replicable, and Sustainable (HRS) criteria during the period 1961–2024. The only exceptions occurred in 2004 and 2009, when male life expectancy fell slightly below the global average due to elevated young male mortality during the civil war. Considering these circumstances exceptional, Sri Lanka can be regarded as the sole “constant HRS” country over the last 62 years.
A comprehensive analysis of 1,497 development indicators from the World Bank databank compared Sri Lanka’s performance with global averages and those of 55 countries[1] classified as “low health efficiency” (defined as lower life expectancy and higher gross burden of health inequity despite higher GDP per capita than Sri Lanka). Key findings include:
- Rural population: Sri Lanka has a significantly higher rural population proportion (80.97%) compared to low health efficiency countries (37.23%).
- Trade policies: The country imposes higher taxes on international trade and import duties (17.1% vs. 6.5% in low health efficiency countries), protecting local production and consumption.
- Health metrics: According to WHO health statistics, Sri Lanka has a lower average body mass index (23.0 vs. global average 25.0), correlated with lower caloric intake per capita (2,594 kcal/day vs. 2,895 kcal/day) and reduced prevalence of overweight individuals (17.3% vs. 34.3%).
- Sri Lanka is also unique as the only lower-middle-income country with 100% health insurance coverage, despite allocating a lower share of GDP to health (4.7% vs. 7.33%) and having a higher out-of-pocket health expenditure proportion (46.5% vs. 16.3%), primarily for medicines.
Other HRS References during the study period (1961-2023):
Two countries met HRS criteria for approximately half the 1961–2023 period: Dominican Republic, primarily during the 1960s–1980s and the Philippines, during the 1960s, 1970s, and 1990s.
Three countries met all HRS criteria for about one-third of the study period: Vietnam, from the mid-1980s to 2010, Tunisia, from the mid-1970s to 2000 and Thailand, from the mid-1970s to 1990.
Additional countries meeting HRS criteria for shorter periods include Syria, China, Tonga, Jordan, Armenia, Albania, and several small island nations such as Dominica, St. Lucia, and Mauritius. High-income countries like South Korea and Portugal met HRS criteria briefly in the 1960s.
In the 1970s and 1980s, approximately 10 countries, representing one-fifth of the world population (largely due to China), met HRS criteria. This number declined in the 1990s. From 2010 onward, only 1–3 countries consistently met HRS criteria, including Sri Lanka, Armenia (until 2005), Vietnam (until 2010), Syria (prior to the war), Cape Verde, and Bangladesh (in the last two years of the study period).
Former preliminary analysis identifies subregions in large countries which meet the HRS criteria and add sensitivity in identifying best health feasible models and in estimating the burden of health inequity[xiv]. Likewise, subnational demographic statistics of Sri Lanka[xv] reveal that the southern districts of Sri Lanka have even higher levels of life expectancy, close to 80 years, still with GDP pc below half the world average.
- Global Burden of Health Inequity
Using Sri Lanka as the quasi-constant HRS reference (as in the previous analysis of 1960-2020[xvi]), we estimated global health inequity by comparing single-age, sex-specific mortality rates across 218 countries over 62 years (1961–2023), based on the (population and deaths) data from the UN Pop Division[xvii](total of 7,365,300 data). Excess deaths relative to HRS levels constituted the Net Burden of Health Inequity (nBHiE), while the proportion of total deaths exceeding HRS levels represented the Relative Burden of Health Inequity (rBHiE).
As we have recently published[xviii], the estimated number of excess deaths (nBHiE) in 2023 totaled approximately 20 million, representing some 25% of all deaths. This marks a decline from 40% in 1961, although fluctuations occurred due to exceptional events such as the civil war in the HRS reference country, Sri Lanka (2004, 2009) and the impact of the COVID-19 pandemic (2020–2021).
Life years lost (LYLxHiE):
Health inequity accounted for an estimated 800 million life years lost annually, representing 10% of potential human life. This figure has remained stable since the turn of the century, with improvements in under-five mortality offset by higher median ages of excess deaths.
- Distribution of the burden of health inequity
- Geographical distribution:
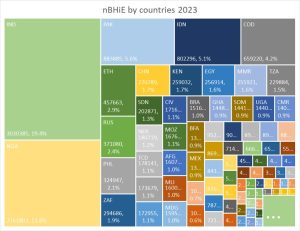
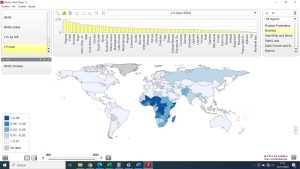
The graph below shows the share of nBHiE by countries in 2023:
Figure 1 Net burden of health inequity by countries, 2023
India has the highest number of annual excess deaths, with over 3 million, almost 20% of the world´s, followed by Nigeria, with over 2 million, almost 14%. Together they add one third of all excess deaths globally. They are followed by Pakistan, Indonesia and DRC, around 5% each, and Ethiopia, Russia, the Philippines and South Africa, from 2-3% each.
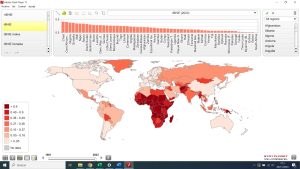
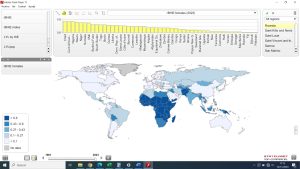
The comparison of the proportion of all deaths which are in excess from feasible/sustainable (HRS) levels, that is, the relative burden of health inequity, is displayed in the following figure.
Figure 2 Relative burden of health inequity by countries, 2023
With close to 90%, Chad has the highest rBHiE, followed by the Central African Republic, Nigeria, Somalia and Niger. In 58 countries deaths in excess of HRS levels are more than half of all deaths, 50 of them are in sub-Saharan Africa.
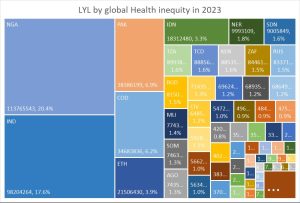
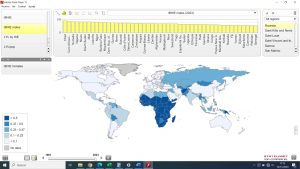
When taking into account the age of each excess (nBHiE) death, the international distribution of life years lost (LLL) by global health inequity shows that Nigeria (with lower median age of its excess deaths) lost last year over 113 million potential human life years, over one in five of all LLL in the world, followed by India, with almost 100 million, 17% of all. They are followed by Pakistan and DR Congo, each with over 35 million LLL and 6% of the world´s. The mentioned five countries comprise over half of the life years lost to health inequity in the world.
Figure 3 International share of life years lost by global health inequity, 2023
In a comparable way, given diverse population sizes, the life years lost per person reflect the highest rates in Nigeria, Chad, Somalia and Niger, with higher than 0.1 (over one month) each. Again, sub-Saharan Africa is the region with higher burden, highest in the Central African belt.
Figure 4 Distribution of life years lost per person, 2023
- Sex distribution:
The comparison between the international rBHiE in males and females relates mainly to higher levels of male than male rBHiE in Russia and former USSR countries, and higher female than male rBHiE in India, Pakistan and part of the Arab world.
Figure 5 Comparison of international rBHiE of females and males, 2023
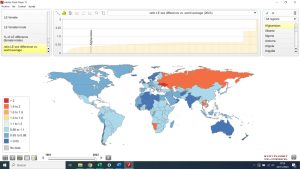
It is interesting to note the differences between male and female life expectancy over time. While in the 1960s the world average difference, always in favor of women, was over 9%, today, after six decades of global progress in women´s rights, it is barely 7%. Taking the world´s average difference, the following map shows those countries with higher-than-average life expectancy sex gap and those with lower.
Figure 6 Life expectancy sex gap ratio to world´s average 2023
The above figure shows how female health is relatively (to world average) better off than men´s in Russia and former Soviet Union´s republics, Namibia, Thailand and Vietnam. Meanwhile, the sex gap in life expectancy is lower than the world average (relatively worse off than what would be expected for women) in regions where women´s rights lag behind as India, Afghanistan, parts of the Arab world and Muslim Sahel, but also in high income/”development”/advanced women´s rights countries as central and northern Europe (notably Scandinavian countries) and Australia/New Zealand.
- Age distribution
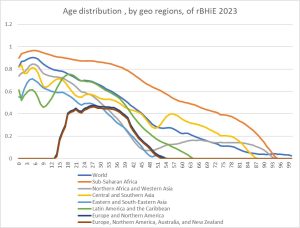
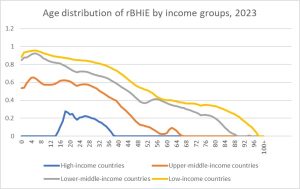
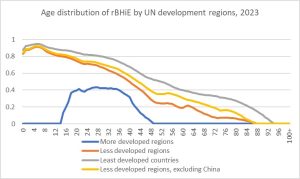
The rBHiE also varies by age and such variations differ between geographic, income and development regions, as the following graphs show:
Figure 7 Average rBHiE age distribution in the world and geo regions
The above figure shows how the proportion of deaths attributable to global inequity is higher in younger age groups and gradually decreases in older age groups. Such pattern is similar in sub-Saharan Africa, yet at higher levels, and in Central and Southern Asia, with a steeper decrease in Latin America, Northern Africa and Eastern and South East Asia and with a hat/elephant shape (the little prince) in Europe and Northern America.
Figure 8 rBHiE average age distribution by country income and development groups 2023
By income and development regions the low income/less and least developed countries follow the decreasing-with-age rBHiE pattern, steeper as average income increases, and the “bump” pattern during the 15–50-year-old group in higher income/development countries.
- Factors influencing the burden of health inequity:
We have plotted the relative burden of health inequity against the following economic and health system variables:
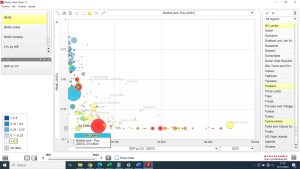
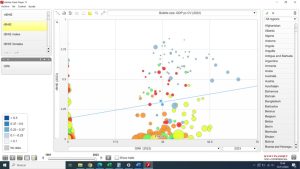
Figure 9 Relative burden of health inequity vs. GDP pc CV, 2023
Similar to the correlation between GDP per capita and life expectancy, the relationship between GDP per capita and the burden of health inequity demonstrates an inverse trend. However, this trend is highly heterogeneous, with the curve flattening above the GDP per capita level of the HRS reference country, Sri Lanka. This analysis highlights the 55 low health-efficiency countries, which have higher GDP per capita than HRS levels but still exhibit significant gross and net health inequity burdens. In some cases, such as the USA, net health inequity (nBHiE) even shows a slight increase at very high GDP per capita levels.
Figure 10 Relation between GINI index and rBHiE, by countries, 2023
We used the national average GINI estimates from the past decade and plotted them against rBHiE levels. The results reveal no clear correlation, as some countries exhibit low inequality but very high rBHiE, and vice versa. The stark contrast between China (GINI 0.46, rBHiE 2%) and India (GINI 0.32, rBHiE 32%) is particularly striking, especially considering that India’s GDP per capita is half the HRS reference level.
However, the relationship becomes more evident as GDP increases. In high-income countries, overall health outcomes—characterized by high life expectancy and low rBHiE—tend to improve as GINI decreases. A notable comparison is between Japan (GINI 0.32, no rBHiE, life expectancy 85 years) and the USA (GINI 0.47, 3% rBHiE, life expectancy 77 years).
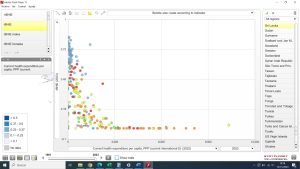
Figure 11 National average health expenditure pc in PPP units, 2022, and rBHiE
The graph above illustrates the relationship between health expenditure per capita and rBHiE. Similar to GDP per capita, there appears to be a threshold of health spending per capita beyond which rBHiE does not decrease further. In fact, some countries with significantly higher health expenditure per capita than the HRS reference still exhibit measurable levels of rBHiE.
The case of the USA is particularly notable: even after adjusting for purchasing power parity, health spending is more than 100 times higher than in Sri Lanka, yet it fails to eliminate rBHiE entirely, though the rates are relatively minor.
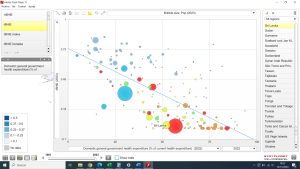
Figure 12 % of health spending pooled by government health spending vs. rBHiE
The proportion of health spending allocated through government services influences better health outcomes, as shown in the figure above. However, this correlation diminishes above 50%—the level seen in the HRS reference. Notably, several countries, including some from the low health efficiency group, exhibit high rBHiE levels despite government health spending exceeding 50%.
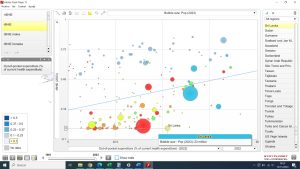
Figure 13 % of health spending through out of pocket, vs. rBHiE 2023
One of the primary barriers to equitable access and coverage of health services, as identified by the WHO[xix], is direct payments at the point of delivery. Surprisingly, the graph above reveals no clear correlation between the share of health spending through out-of-pocket payments and rBHiE levels. For example, Sri Lankan citizens allocate one-third of their health budget to direct payments, particularly for medicines at the primary care level, yet remain the HRS reference, with null rBHiE.
Conversely, some countries with a much lower share of out-of-pocket payments, particularly in sub-Saharan Africa (represented by blue bubbles), exhibit high rBHiE rates. Most countries with lower rBHiE levels, such as those in Europe and East Asia, tend to have smaller shares of direct health spending, though this relationship is complicated by GDP per capita as a confounding variable.
The contrast between China and India highlights the complexity of this issue: China has significantly better health outcomes and lower direct health spending, while India has twice the share of out-of-pocket payments and far poorer health indicators. These findings suggest a complex, nonlinear relationship influenced by numerous other factors.
Figure 14 Relation between human resources for health and health outcomes
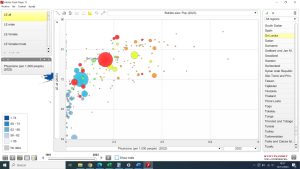
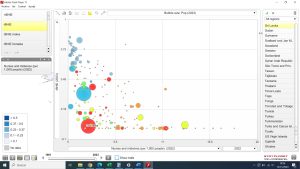
As with health financing, the number of health professionals influences better health (higher life expectancy and lower rBHiE) until reaching a certain threshold above which the curve flattens. The HRS reference enjoys best feasible/sustainable health with 1 physician and 3 nurses/midwives per thousand people, and Japan, the country with highest life expectancy, has 2 physicians and 10 nurse/midwives per each 1000 people. Income, living conditions and overall health financing qualify this and all correlations above described.
Conclusions
The updated identification of the best feasible levels of health, essential for monitoring progress toward the sole global health objective—achieving the best feasible health for all people—continues to highlight Sri Lanka as the sole constant Health Reference Standard (HRS) from 1961 to 2023. This update, alongside the recent revision of international demographic data by the United Nations, has significantly enhanced the sensitivity of estimates by increasing the sample size of population and mortality data by country, time period, sex, and age by 25-fold.
Currently, the burden of health inequity accounts for approximately 20 million excess deaths annually (net burden), representing roughly 25%—or one in four—of all deaths. This equates to around 800 million human life years lost annually, compared to the potential achievable under best feasible health for all populations.
We explored factors underlying the singularity of the HRS model by comparing a wide range of variables between the HRS reference (Sri Lanka), the global average, and low-health-efficiency countries (those with higher GDP per capita than HRS but lower life expectancy and higher gross burdens of health inequity). Key findings include:
- The HRS model features a higher rural population share, lower weight-for-age and calorie intake per capita, lower global trade engagement, and a tax-based universal health system.
- Surprisingly, the HRS model has a lower government health spending share and a higher reliance on out-of-pocket payments compared to other systems.
Analysis of the distribution of the burden of health inequity revealed several critical insights:
- India bears the highest net burden of health inequity (nBHiE), with over 3 million excess deaths annually.
- Nigeria experiences the highest number of life years lost due to global health inequity (over 110 million annually).
- Chad has the highest relative burden of health inequity (rBHiE), with over 90% of all deaths attributed to inequity.
- Sub-Saharan Africa, particularly its tropical belt, remains the region most severely impacted by health inequity.
Sex-specific analysis shows that globally, women experience a higher rBHiE than men (approximately 30% vs. 27%), and this gap has widened since the 1960s. Notably, the genetic advantage of women in life expectancy has decreased, with the life expectancy gap shrinking from 9% in the 1960s to 7% today. Among regions:
- The former Soviet Union exhibits the largest sex gap, with women often better off or men worse off than expected.
- Conversely, India, the Arab/Muslim world, and, surprisingly, high-income countries with high women’s rights indices (e.g., Central and Northern Europe, the USA, and Australia) show a smaller-than-average life expectancy gap between sexes.
Age-specific patterns reveal that in regions with high rBHiE—such as sub-Saharan Africa, low-income regions, and least-developed countries—the burden is disproportionately concentrated among children and declines with age. In contrast, countries with lower rBHiE levels show a steeper decline with age, with high-income countries experiencing rBHiE primarily among young adults.
Our analysis of variables associated with higher BHiE levels found that factors such as income inequality (measured by GINI), government health spending shares, out-of-pocket payment shares, and total health spending (adjusted for GDP per capita) are not major determinants of the burden of health inequity, contrary to initial assumptions.
As emphasized in previous studies, advancing to higher-sensitivity analyses using subnational data worldwide is crucial. Such analyses would enable the identification of healthier, more equitable, and sustainable health models, distinct from existing HDI paradigms. They would also provide a clearer understanding of the levels and distribution of health inequity and social injustice, facilitating fair global redistribution efforts and supporting progress toward the universal right to health and the best feasible health for all populations.
Footnote
[1] Algeria, American Samoa, Armenia, Aruba, Azerbaijan, Bahamas, The, Barbados, Belarus, Belize, Botswana, Brazil, Brunei Darussalam, Bulgaria, Curacao, Dominica, Dominican Republic, Egypt, Arab Rep., El Salvador, Equatorial Guinea, Fiji, Gabon, Georgia, Grenada, Guatemala, Guyana, Indonesia, Iraq, Jamaica, Kazakhstan, Libya, Lithuania, Malaysia, Marshall Islands, Mauritius, Mexico, Mongolia, Montenegro, Namibia, Nauru, North Macedonia, Palau, Paraguay, Romania, Russian Federation, Serbia, Seychelles, Sint Maarten (Dutch part), South Africa, St. Kitts and Nevis, St. Lucia, St. Vincent and the Grenadines, Suriname, Tonga, Trinidad and Tobago, Turkmenistan
References
[i]Garay JE, Chiriboga DE. A paradigm shift for socioeconomic justice and health: from focusing on inequalities to aiming at sustainable equity. Public Health. 2017 Aug;149:149-158. doi: 10.1016/j.puhe.2017.04.015. Epub 2017 Jun 20. PMID: 28645046.
[ii] https://www.interacademies.org/news/launching-global-health-equity-atlas
[iii]https://population.un.org/wpp/
[iv]https://www.thelancet.com/journals/lancet/article/PIIS0140-6736(24)01339-4/fulltext
[v]https://www.peah.it/2023/12/12800/
[vi]Garay, J., Chiriboga, D., Kelley, N., & Garay, A. (2019, February 25). Health Equity Metrics. Oxford Research Encyclopedia of Global Public Health. Retrieved 20 Nov. 2024, from https://oxfordre.com/publichealth/view/10.1093/acrefore/9780190632366.001.0001/acrefore-9780190632366-e-62.
[vii]https://www.peah.it/2024/10/identifying-international-sustainable-health-models/
[viii]https://databank.worldbank.org/
[ix]https://data.footprintnetwork.org/#/
[x]https://data.who.int/indicators/i/48D9B0C/C64284D#:~:text=Worldwide%2C%20healthy%20life%20expectancy%20at,%2D%2062.7%5D%20years%20in%202021.
[xi]https://www.footprintnetwork.org/what-biocapacity-measures/#:~:text=Given%20the%2012.2%20billion%20hectares,biocapacity%20per%20person%20on%20Earth.
[xii]https://www.nature.com/articles/s41558-023-01848-5
[xiii]https://www.peah.it/2024/07/13556/
[xiv]https://www.peah.it/2024/11/the-price-of-global-injustice-in-loss-of-human-life/
[xvi]https://www.peah.it/2021/04/9658/
[xvii] https://population.un.org/wpp/
[xviii]https://www.peah.it/2024/11/the-price-of-global-injustice-in-loss-of-human-life/
[xix] Sirag A, Mohamed Nor N. Out-of-Pocket Health Expenditure and Poverty: Evidence from a Dynamic Panel Threshold Analysis. Healthcare (Basel). 2021 May 3;9(5):536. doi: 10.3390/healthcare9050536 PMID: 34063652; PMCID: PMC8147610
—
By the same Author on PEAH


The Price of Global Injustice in Loss of Human Life

Identifying International Sustainable Health Models

Homo Interitans: Countries that Escape, So Far, the Human Bio-Suicidal Trend

Human Ethical Threshold of CO2 Emissions and Projected Life Lost by Excess Emissions

 Restoring Broken Human Deal

   Towards a WISE – Wellbeing in Sustainable Equity – New Paradigm for Humanity

  A Renewed International Cooperation/Partnership Framework in the XXIst Century

 COVID-19 IN THE CONTEXT OF GLOBAL HEALTH EQUITY

 Global Health Inequity 1960-2020 Health and Climate Change: a Third World War with No Guns

 Understanding, Measuring and Acting on Health Equity
