IN A NUTSHELL Author's NoteAchieving fairness in humanity is vital to realizing the global health goal outlined in the WHO Constitution: ensuring the highest attainable level of health for all people. As Plato observed over 2,300 years ago, a just society is one where everyone has enough, and no one has too much. By analyzing healthy, replicable, and sustainable (HRS) countries—characterized by features such as more rural lifestyles, localized economies, and lower calorie consumption—we can estimate the "dignity threshold." This threshold represents the minimum level of GDP per capita below which, in 62 years of available records, no country has achieved optimal health outcomes. We also identified a "GDP per capita proxy," reflecting the income and wealth levels of countries and regions with the highest life expectancy—a widely recognized indicator of health and human well-being. Beyond this level, referred to as the "excess threshold," additional GDP per capita does not result in improved health or well-being and has been described by some as "wasted GDP." Moreover, we determined the GDP per capita level above which global resources could be redistributed to address the equity deficit, potentially preventing 12.6 million deaths annually in countries below the dignity threshold. GDP exceeding this level not only fails to enhance human well-being but also violates planetary boundaries and contributes to loss of life. We have therefore labeled it "toxic GDP." The next step in this analysis involves further exploration and identification of HRS population groups, their defining features, and the equitable levels of global redistribution—both subnational and international—to achieve global health equity and uphold the universal right to health

By Juan Garay
Professor of global health equity in Spain (ENS), Mexico (UNACH) and Cuba (ELAM, UCLV and UNAH), senior researcher of FioCruz Institute, Brazil
Enough is Enough, and More is Too Much
Between Basic Dignity and Excess/Hoarding Thresholds
The form of law which I should propose would be as follows:

In a state desirous of being saved from the greatest of all plagues -here should exist among the citizens neither extreme poverty, nor, again, excess of wealth, for both are productive of both these evils. Now, the legislator should determine what is to be the limit of poverty or wealth.

Laws by Plato, 360 BC.
Scene Setting
1948 marked a pivotal moment in humanity’s collective commitment to uphold universal human rights, including the right to health (Article 25) [1], as defined in the Constitution of the World Health Organization (WHO). Health was described as “a state of complete physical, mental, and social well-being,” and the WHO Constitution came into force that same year.
The WHO Constitution obliges all 194 member states to contribute to its foundational goal: achieving the highest attainable level of health for all people[2]. However, this “best feasible level” has never been explicitly identified by the WHO, nor by any country or multilateral institution. This omission may reflect an anthropocentric perspective, which perceives humans as separate from and superior to nature, assigning intrinsic value solely to human life while viewing other entities—such as animals, plants, and natural resources—as mere resources to be exploited for human benefit[3]. This perspective continues to prioritize human life above all else, often without setting any boundaries.
Capitalism, aligned with anthropocentrism[4], has promoted constant competition and “growth” as the pathways to human progress and well-being. These concepts have dominated both ancient and modern history, likely hindering our ability to set limits on the exploitation of the planet that sustains our species—perhaps not for much longer.
We challenge these notions and have ventured to define “feasible levels of health,” recognizing that they must evolve alongside expanding human knowledge and the diminishing natural resources available to us. Even Adam Smith, the father of capitalism, cautioned against the uncritical reverence of the rich and powerful.
“The disposition to admire, and almost to worship, the rich and the powerful, and to despise, or, at least, to neglect persons of poor and mean condition is the great and most universal cause of the corruption of our moral sentiments.” – Adam Smith, Scottish political economist, author, The Wealth of Nations, father of capitalism [1723-1790].
The primary dimensions where limited resources may define feasibility thresholds are ecology and economy. As evidence of environmental depletion and imbalances—most notably global warming—has become undeniable, the ecological limits to human activity on the planet have grown increasingly clear and measurable[5]. The way we utilize, and often exploit, natural resources is closely linked to levels of production, trade, and consumption, typically measured by gross national or domestic product (GNP or GDP).
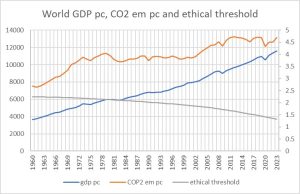
As illustrated in the graph below, the world’s average GDP per capita (constant value) has steadily increased over the past six decades, despite brief periods of economic recession, notably in the late 1970s and the late 2010s. This growth correlates with rising per capita CO2 emissions, which have now surpassed the ethical threshold (i.e., the carbon budget required to limit global temperature increases to below 2°C and maintain human life prospects throughout the 21st century).
Figure 1 Evolution of GDP pc, CO2 emissions pc and CO2 ethical threshold
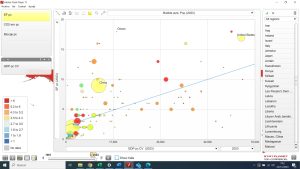
The graph below illustrates the strong correlation between a country’s consumption-based ecological footprint[6] and its GDP per capita. Outliers with an ecological footprint seemingly lower than predicted by their GDP per capita are primarily countries that rely heavily on imports of natural resources and manufactured goods produced offshore. In these cases, the full environmental impact—assessed through life cycle analysis, which measures a product’s environmental footprint across all phases of its life, from production to disposal—is not fully accounted for[7].
Figure 2 Correlation between GDP pc and CO2 emissions pc, by countries, 2023
There is a strong correlation between economic activity and its direct or indirect impact on natural resources. However, the economy itself has inherent limits, as the scale of production, trade, and consumption cannot be expanded to provide the highest levels for all. Logically, any country with a GDP per capita above the world average cannot be globally replicable at a given time.
Based on these assumptions, we have been identifying countries and subnational population groups that achieve the best health outcomes within feasibility thresholds—that is, those that respect planetary boundaries and maintain economic activity below the world average. Both factors show strong correlation. Since 1961, we have found no country with per capita carbon emissions below the ethical threshold or an ecological footprint below the world average biocapacity per capita, paired with a GDP per capita above the world average.
The identification of Healthy-Replicable-Sustainable (HRS) standards has enabled us to assess the status and progress toward the sole global health goal defined in the WHO Constitution—achieving the best feasible health for all. It has also allowed us to inversely estimate the gap in health outcomes as “excess mortality” (avoidable deaths) compared to the HRS reference.
Data are analyzed periodically by country, time period, sex, and age group, as availability permits. Recent analyses suggest that approximately 16 million excess deaths occur annually—representing 25% of all deaths—a proportion that has remained relatively stable over the past four decades. Excess mortality is disproportionately higher among women (30%), children under 15 years old (80%), and populations in low-income or low-“development” countries (approximately 50%)[8].
Equinomics
Dignity Threshold and Deficit Countries
The identification of “best feasible levels of health,” as described above, enables us to determine the level of GDP per capita associated with the HRS (Healthy-Replicable-Sustainable) reference. This is the threshold below which no country has been able to achieve the shared global health commitment, representing the universal right to health—the most fundamental of all human rights.
Since human rights define the basic standards necessary for a life of dignity, we refer to the HRS GDP per capita as the “dignity threshold.”
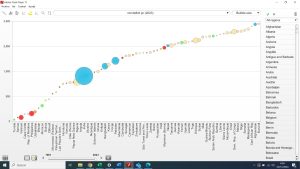
Figure 3 Deficit pc below the ethical threshold, by country, 2023
The graph above illustrates the 72 countries that, in 2023, had a national average GDP per capita below the previously defined dignity threshold and were therefore unable to achieve the best feasible level of health as outlined in the WHO’s constitutional goal. These countries are referred to as “deficit countries.” As shown in the graph, with bubble sizes representing population figures, the per capita deficit ranges from $3,707 per year in Burundi to $67 per year in Tunisia.
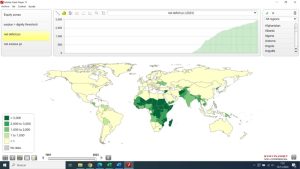
Figure 4 Countries with average GDP pc below the dignity threshold, 2023
As illustrated in the figure above, the deficit countries in 2023 are primarily located in sub-Saharan Africa. They also include Bolivia, Venezuela, Honduras, Guatemala, and Haiti in the Americas; Morocco in Northern Africa; Yemen, Syria, and the Palestinian territories in the Middle East; Ukraine and Moldova in Europe; Tajikistan, Kyrgyzstan, Uzbekistan, Pakistan, and Afghanistan in Central Asia; India, Bangladesh, Nepal, Bhutan, and Myanmar in South Asia; Laos, Cambodia, and the Philippines in Southeast Asia; North Korea in East Asia; and Papua New Guinea, Timor-Leste, Vanuatu, Kiribati, the Solomon Islands, and Samoa in the Pacific.
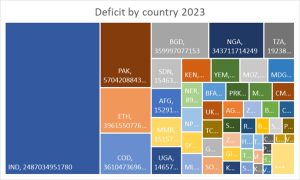
Figure 5 Deficit GDP by country, 2023
The graph above shows that nearly one-third of the world’s deficit in 2023 is attributable to India, followed by Pakistan, Ethiopia, the Democratic Republic of the Congo, Bangladesh, and Nigeria, each contributing around 5%. Together, these six countries account for half of the global deficit below the dignity threshold.
All countries within the deficit zone experience excess deaths above the HRS reference mortality rates. In 2023, the total number of excess deaths in these deficit countries—representing the net burden of health inequity—reached 12.6 million.
The proportion of excess deaths in relation to all deaths (relative burden of health inequity) in each deficit country is displayed in the graph below.
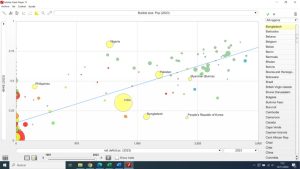
Figure 6 rBHiE by countries in relation to deficit pc, 2023
While the graph above shows a general correlation between higher deficit GDP per capita and higher relative burden of health inequity (rBHiE), there are several notable outliers. For instance, Nigeria has a much higher excess rBHiE (81%) compared to India (32%) or Bangladesh (20%). In general, sub-Saharan deficit countries tend to have a higher rBHiE than Asian deficit countries, even when their deficit GDP per capita levels are similar.
Excess Threshold and Surplus Countries
The analysis that follows presents one of the most provocative conclusions of the global atlas of health inequity, as it challenges the cultural and economic goals of the dominant market economy/capitalist system, which seeks ever-increasing GDP growth. Not only are GDP per capita levels above a certain threshold now incompatible with the sustainable use of natural resources, but, as the following paragraphs will demonstrate, there is a threshold beyond which human well-being and life expectancy no longer improve and, in fact, may even worsen.
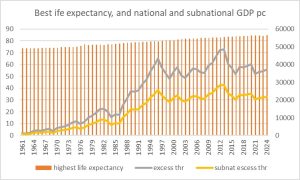
We identified the countries with the highest life expectancy each year from 1961 to 2023, and examined their life expectancy and GDP per capita levels. From 1961 to 1983, Iceland (11 years), Sweden (10 years), and the Netherlands (1 year) had the highest national average life expectancy. From 1984 to the present, Japan has consistently had the highest national average life expectancy. We then analyzed the subnational regions within Japan with the highest life expectancy, focusing on the prefecture of Nara, which reported life expectancy levels of 84.31 years (87.21 for women and 81.36 for men) that exceed the national average, with a GDP per capita of $26,653. The graph below shows the evolution of the highest national levels of life expectancy and their corresponding GDP per capita at both the national and best subnational levels.
Figure 7 Evolution of the highest national life expectancy and its national and subnational GDP pc, 1961-2023
We refer to the GDP per capita of the subregion with the highest life expectancy as the “excess threshold,” above which life expectancy—considered the best measurable proxy for human well-being—ceases to improve further.
The greatest country, the richest country, is not that which has the most capitalists, monopolists, immense grabbings, vast fortunes, with its sad, sad soil of extreme, degrading, damning poverty, but the land in which there are the most homesteads, freeholds — where wealth does not show such contrasts high and low, where all men have enough — a modest living— and no man is made possessor beyond the sane and beautiful necessities.” –Walt Whitman [1819-1892].
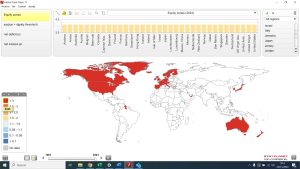
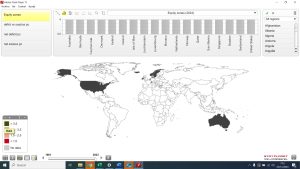
The map below shows the countries with GDP pc higher than the excess threshold in 2023.
Figure 8 Countries with GDP pc above the excess threshold, 2023
The map above shows that countries such as North America, the European Union (excluding Eastern Europe and Greece), Japan, South Korea, Australia, New Zealand, and Guyana (due to recent oil-related GDP growth), as well as Israel, Qatar, Kuwait, and the United Arab Emirates in the Middle East, have GDP per capita above the excess threshold. This level of GDP is often referred to as “wasted GDP,” as it no longer contributes to improvements in life expectancy or human well-being[9].
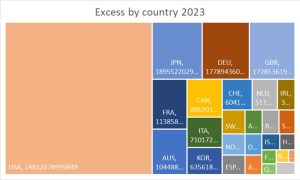
Figure 9 Excess ("wasted") GDP above the excess threshold, by countries, 2023
In 2023, excess GDP above the threshold—beyond which life expectancy and human well-being no longer improve—is concentrated in the USA, accounting for approximately 40% of the global excess. This is followed by Japan, Germany, and the United Kingdom, each with around 8%. The G7 countries collectively hold two-thirds of the global excess GDP, which is ineffective in improving human well-being. This amount is also twice the level required to address the world’s equity deficit and help prevent most of the burden of health inequity, as shown below.
Hoarding threshold
Within countries with excess GDP per capita, we identified the GDP per capita level above which the leveled-off GDP would close the gap in deficit countries. We achieved this by ranking countries according to their GDP per capita and calculating the cumulative differential GDP (GDP per capita multiplied by population). The hoarding threshold represents the GDP per capita above which the cumulative differential GDP meets the deficit gap.
GDP above this level is not only incompatible with respecting planetary boundaries, but it also undermines the right to health for half of the world’s population. As shown below, it indirectly causes over 12 million excess deaths, which is why we refer to it as “toxic GDP.” [10]
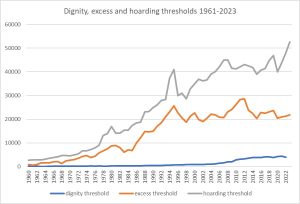
For most of the study period, the number of countries with GDP per capita above the hoarding threshold was fewer than 10, meaning that only the excess GDP from these countries could have closed the deficit gap. The following graph shows the evolution of the excess and hoarding thresholds.
Figure 10 Excess and hoarding thresholds 1961-2023
The graph above illustrates how the hoarding threshold increased in parallel with the excess threshold throughout the 20th century, with a difference of about $10,000 between them during the 1980s and 1990s. Since the turn of the century, the hoarding threshold has risen at a much faster rate, reaching a difference of $20,000 by 2010, a gap that has remained stable since then and peaked in the last three years, after the COVI pandemic, to over $30,000.
The map below highlights the countries with GDP per capita above the hoarding threshold. The leveled-off GDP in these countries, which is significantly higher than even the “wasted” excess threshold, could close the global GDP deficit and ensure that all people live above the dignity threshold.
Figure 11 Countries with GDP pc above the hoarding threshold, 2023
Live simply so that others may simply live.

Mahatma Gandhi
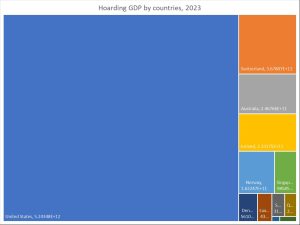
Figure 12 Hoarding GDP by countries, 2023
The graph above shows that 68% of the GDP above the hoarding threshold (which is ineffective for human well-being and sufficient to address the world’s GDP deficit and enable global justice/health equity) remains in the USA. This is followed by smaller shares in Switzerland, Australia, Ireland, and Norway, ranging from 5% to 2%.
Equity Zones
The identification of the aforementioned thresholds allows for the definition of the following “equity zones”: deficit (below the dignity threshold), equity (between the dignity and excess thresholds), excess (between the excess and hoarding thresholds), and hoarding (above the hoarding threshold) zones.
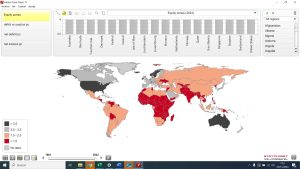
The following map illustrates the distribution of countries in the world in 2023 according to their equity zone.
Figure 13 Countries by equity zone, 2023 (black hoarding, grey excess, orange equity, red deficit)
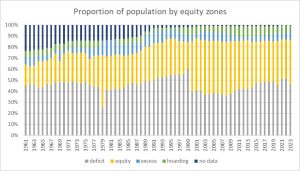
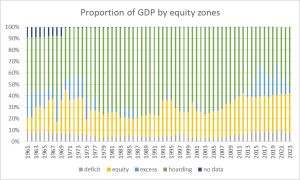
The following graphs represent the evolution of the proportions of the population and GDP by equity zones in the world, from 1961 to 2023:
Figure 14 Proportion of the world population by countries ‘equity zone, 1961-2023
The distribution of the world’s population by countries’ equity zones reveals that around half of humanity lives in countries where GDP per capita is below the dignity threshold, preventing them from enjoying the universal right to health as pledged by all nations under the 1948 WHO Constitution. The fluctuation in 1978 is due to the temporary advancement of India, Indonesia, and Pakistan from the deficit zone to the equity zone, while the shift in 1999 was driven by China’s progress from the deficit to the equity zone, a trend that has remained stable since then.
The graph also shows that the proportion of the global population living in countries within the equity zone has increased from less than 20% in 1961 (partly due to limited data, especially in low-income countries) to around 40% since the turn of the century, largely due to China’s inclusion. The proportion of the world’s population living in countries with GDP per capita above the excess threshold has remained relatively stable, fluctuating between 10-15%, with about half of this population in the hoarding zone.
Figure 15 Proportion of the world´s GDP by countries´ equity zone, 1961-2023
The graph above illustrates the skewed and inequitable distribution of global resources, as reflected by GDP according to countries’ equity zones. When compared to the previous graph on population by equity zone, it is evident that from 1961 to 2023, around half of the world’s population has had access to less than 10% of the world’s resources, living without the universal right to health. Meanwhile, less than 10% of the global population, residing in countries with GDP per capita above the excess threshold, has controlled between 60% and 80% of the world’s resources. Even more striking is the fact that less than 5% of the world’s population, living in countries in the hoarding zone, consumes half of the world’s resources.
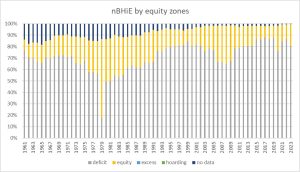
This extreme inequality in the distribution of the world’s resources—natural means translated into goods and financial power—leads to the loss of human life, as illustrated by the distribution of the net and relative burden of health inequity, shown in the following graphs.
Figure 16 Proportion of excess deaths (nBHiE) by equity zones 1961-2023
The graph above reveals that 80% of the world’s excess deaths—those exceeding the best feasible health level (HRS)—occurred between 1961 and 2023 in countries with a national average GDP per capita below the dignity threshold. The variation in 1978 is due to the temporary inclusion of India, which accounted for nearly half of the world’s net burden of health inequity (nBHiE), in the equity zone. The increase in the share of nBHiE within the equity zone after 1999 is attributable to China’s inclusion in that zone. In 2023, the nBHiE in deficit countries was 12.6 million (out of a total of 15.6 million), highlighting the extreme unfair distribution of global resources by countries.
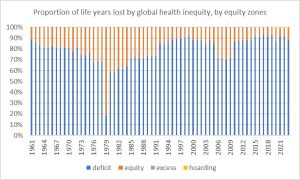
This inequitable distribution becomes even more striking when we examine the distribution of life years lost by equity zone, as shown in the following graph.
Figure 17 Proportion of human life years lost due to global health inequity, by equity zone, 1961-2023
The graph above demonstrates that 90% of all life years lost due to global injustice and health inequity occur in countries with GDP per capita below the dignity threshold. This highlights how income above a certain minimum level is essential for achieving the universal right to health and the best feasible level of health.
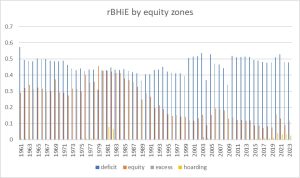
The following graph illustrates the proportion of all deaths that exceed the HRS reference (rBHiE) by equity zone.
Figure 18 rBHiE by equity zone, 1961-2023
The rBHiE in the deficit zone has averaged between 40-50% from 1961 to 2023, remaining fairly stable around 50% since the turn of the century. In contrast, the rBHiE in the equity zone decreased from around 40% in the 1980s to about 10% since the early 2000s. The rBHiE in the excess and hoarding zones has remained very low, except for the 1981-1983 period, when some oil-exporting countries in the hoarding category experienced a higher burden. A recent peak in rBHiE was observed during the COVID-19 pandemic, with lingering effects into 2023, resulting in 1.6% in the excess zone and 2.6% in the hoarding zone—interestingly, these figures were higher than usual.
Conclusions
Market-driven societies, despite some inclusive policies like the European social model, have been unable to set limits on GDP, income, and wealth. This dynamic has led to exceeding planetary boundaries, threatening the survival of both humans and other forms of life, while allowing around 5% of the global population to hoard resources. As a result, half of the world lives with resources below levels compatible with the right to health. The cost of the current system is approximately 12.5 million excess deaths annually. This unfair inequality, which leads to a silent genocide and ecocide, demands a profound transformation. We must ensure dignity-level resources for all, limiting accumulation beyond the hoarding threshold and moving towards the excess threshold. As we are already analyzing, such redistribution could prevent the tragic burden of excess mortality and release wasted GDP (around 27% of global GDP) to invest in global public goods and advance human well-being in harmony with nature.
References
[1] https://www.un.org/en/about-us/universal-declaration-of-human-rights
[2] https://www.who.int/about/governance/constitution
[3] https://www.britannica.com/topic/anthropocentrism
[4] https://www.britannica.com/topic/anthropocentrism
[5] https://www.stockholmresilience.org/research/planetary-boundaries.html
[6] https://www.footprintnetwork.org/what-ecological-footprints-measure/
[7] https://ecochain.com/blog/life-cycle-assessment-lca-guide/#LCA-criticism
[8] The geography of world injustice measured by global health inequity. (In press for cadernos de FioCruz, Brazil and PEAH).
[9] https://www.nature.com/articles/s41599-023-02210-y
[10] https://www.peah.it/2024/04/13164/
—
By the same Author on PEAH

Geography of Global Injustice: State of the Burden of Global Health Inequity in 2023

The Price of Global Injustice in Loss of Human Life

Identifying International Sustainable Health Models

Homo Interitans: Countries that Escape, So Far, the Human Bio-Suicidal Trend

Human Ethical Threshold of CO2 Emissions and Projected Life Lost by Excess Emissions

 Restoring Broken Human Deal

   Towards a WISE – Wellbeing in Sustainable Equity – New Paradigm for Humanity

  A Renewed International Cooperation/Partnership Framework in the XXIst Century

 COVID-19 IN THE CONTEXT OF GLOBAL HEALTH EQUITY

 Global Health Inequity 1960-2020 Health and Climate Change: a Third World War with No Guns

 Understanding, Measuring and Acting on Health Equity
